User Guide
Our Company in Detail Page: To get started, enter a ticker (or company name) and GO:
- This brings you to the most recent data for that company, AS REPORTED.
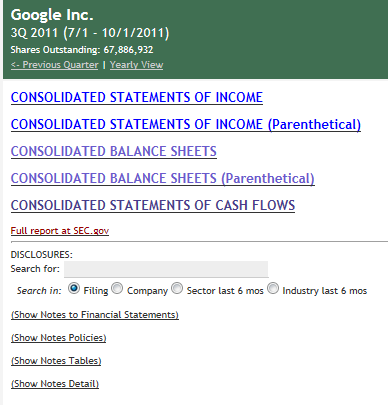
- Open an individual statement or disclosure:
- Compare it to previous periods, or other companies.
- Mouse over any element or name for more options.
- CLICK ON any number and it will show up in the calculator!
- OR enter a scratch line to perform calculations.(e.g. ‘=$345,122/4’ then hit enter)
- Log in to:
- Add comments
- Save your scratch line notes/calculations for later and for others to see.
- Or save your entire view!
- You will get a url link to this view, so you or anyone you want to share it with can access it from anywhere.
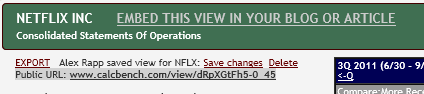
- Or generate HTML code for a widget that embeds this view in your webpage, blog, etc.
- Click ‘export’ to send it to a spreadsheet on your computer
- OR click ‘SPREADSHEET VIEW’ to work with it in our online spreadsheet.
- REMEMBER you must log in before you start in order to save you data!
- After you save a spreadsheet you can share the public link to it with anyone you like.
Cool stuff we are doing for you:
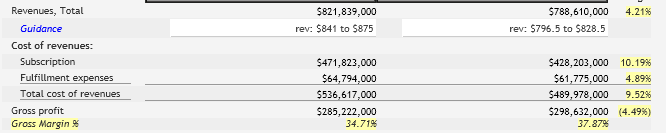
- Automatic calculations: Highlighted in yellow…we’ll calculate things like gross margin or debt to equity when applicable, or the % change period over period.
- Q4 calculation: Companies often do not report Q4 data, rather opting to report full year data instead. We’ll automatically calculate it for you. Data in blue is calculated.
Remember: we are drawing from XBRL data, which is relatively new. The amount of time you can go back will vary by company.