You might remember that several weeks ago Calcbench previewed our airline earrings analysis tool, an Excel template we cooked up to study earnings and other key performance metrics in the airline industry.
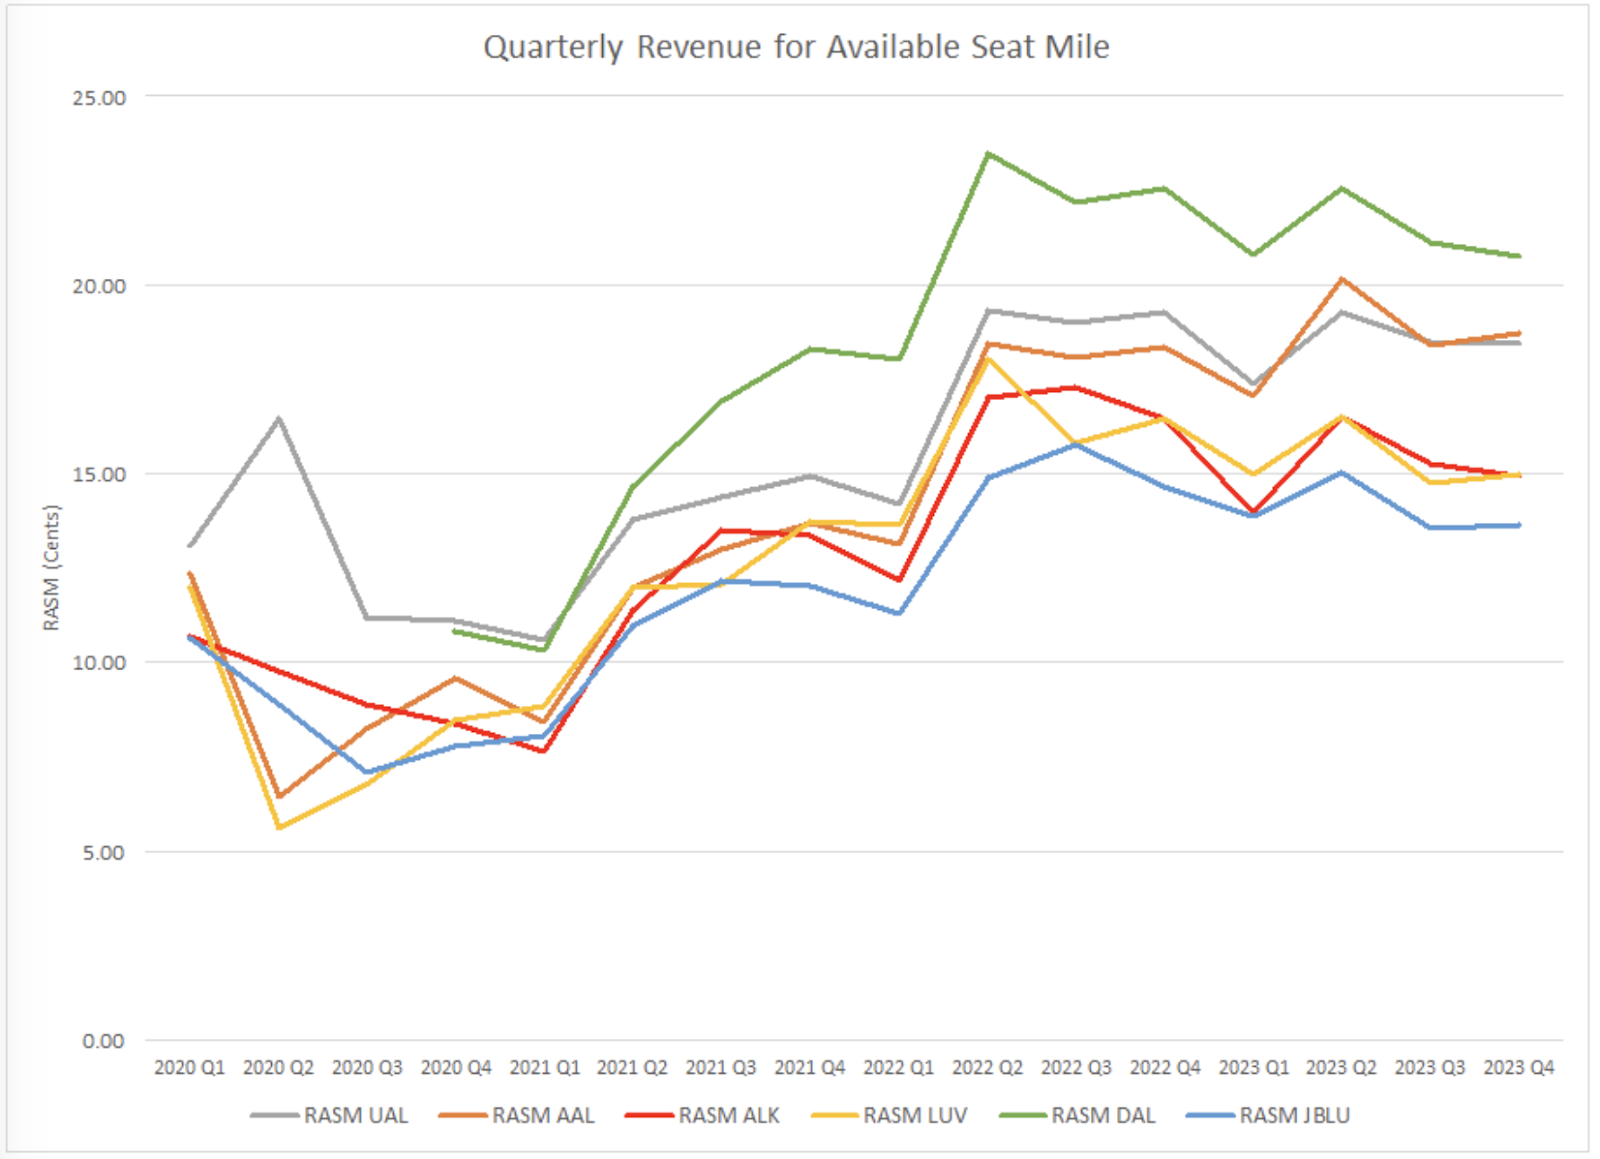
Well, all major U.S. airlines have now reported their Q4 2023 earnings, and we’re happy to say our template worked like a charm. Here’s a quick chart tracking total revenue per available seat mile — TRASM, a crucial metric for airline performance — since the start of 2020.
If you are a Professional-level Calcbench subscriber and have installed the Calcbench Excel Add-In, all you need to do is download our template from DropBox. The template will then automatically pull the latest quarterly data as the airlines file earnings reports.
TRASM isn’t the only metric our template tracks, either. You can get automatic updates on…
- TRASM, or total revenue per available seat mile
- CASM, costs per available seat mile
- Load factor, which is the percentage of seating capacity filled by customers
- Fuel consumed
- Average fuel cost per gallon
- Percentage of revenue coming from passengers
- EPS
Calcbench has been using this template internally for a while now, such as when we looked at fuel costs for five major airlines last October or when we looked at RASM for those same five airlines last July. We are happy to share it far and wide. (Although the template won’t work unless you have a Professional-level subscription. If you’d like to inquire with us about that, email info@calcbench.com.)
We will share more templates in other industries throughout 2024. Until then, you’re free to unbuckle and move about the financial statements.