Over the weekend, the New York Times Magazine published an article entitled ‘Why Are Corporations Hoarding Trillions?’ by Adam Davidson.
At Calcbench, we knew that the number was correct. We also know that there are subtleties that make cash balances at the corporate level difficult to ascertain and compare on an apples to apples basis. For example, some (or most) of a firm’s cash may be held overseas, and it may be difficult to repatriate. Perhaps, the firm has no intention of bringing any foreign cash back to the US and wishes to boost its international operations.
We aren’t here to politicize a trend. But, what we can do is to measure, measure and measure again. We give our customers the ability to do the same.
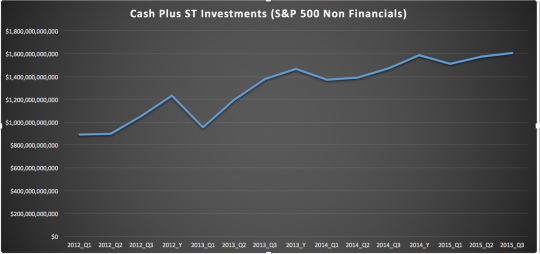
For each quarter going back to the first quarter of 2012, we took the non-financial firms in the S&P500 and got their cash and cash equivalents. We added their short term investments to that. The results are aggregated in the graph below. All of this was done using our tools on Calcbench. You can do the same.
As you see, the levels of cash are steadily rising. We count over 1.6 Trillion dollars at the end of Q3 2015. There are 409 non-financial firms in our sample which leads to an average position just short of $4 Billion per firm ($ 3.93 Billion). At the beginning of 2012, the same figure was $2.3 Billion per firm! This represents an increase of over 70% per firm!
Questions? Please let us know by sending mail to us@calcbench.com
