As the paranoia and uncertainty about our economy rolls merrily along, one question has been how much inventory factors into Corporate America’s behavior these days.
Is inventory growing too much, because customers aren’t buying enough? (Bad; recession might be near.) Is it falling, because customers are tearing products off the shelf? (Kinda bad; that might prompt the Fed to raise interest rates.) Or is it hovering near some equilibrium, keeping pace with the mildly good economic growth we’ve been seeing lately? (Kinda good, depending on your perspective.)
The short answer is that total inventory, among all filers reporting inventory on the balance sheet, is growing: up 5.13 percent, from $1.08 trillion in first quarter 2012 to $1.14 trillion in second quarter 2016. (See Figure 1, below.) The peak came in third quarter 2014, when inventory reached $1.22 trillion.

That’s not an entirely fair comparison, since inventory levels do tend to fluctuate depending on the quarter of the year. For example, third quarter inventory is usually higher than first quarter levels because many companies are preparing for holiday sales in the fourth quarter.
Still, even when you compare the same calendar quarters, you get the same upward trend. Inventory values in first quarter 2016 were 7.29 percent higher than first quarter 2012; they were 3.89 percent higher from fourth quarter 2012 to fourth quarter 2015.
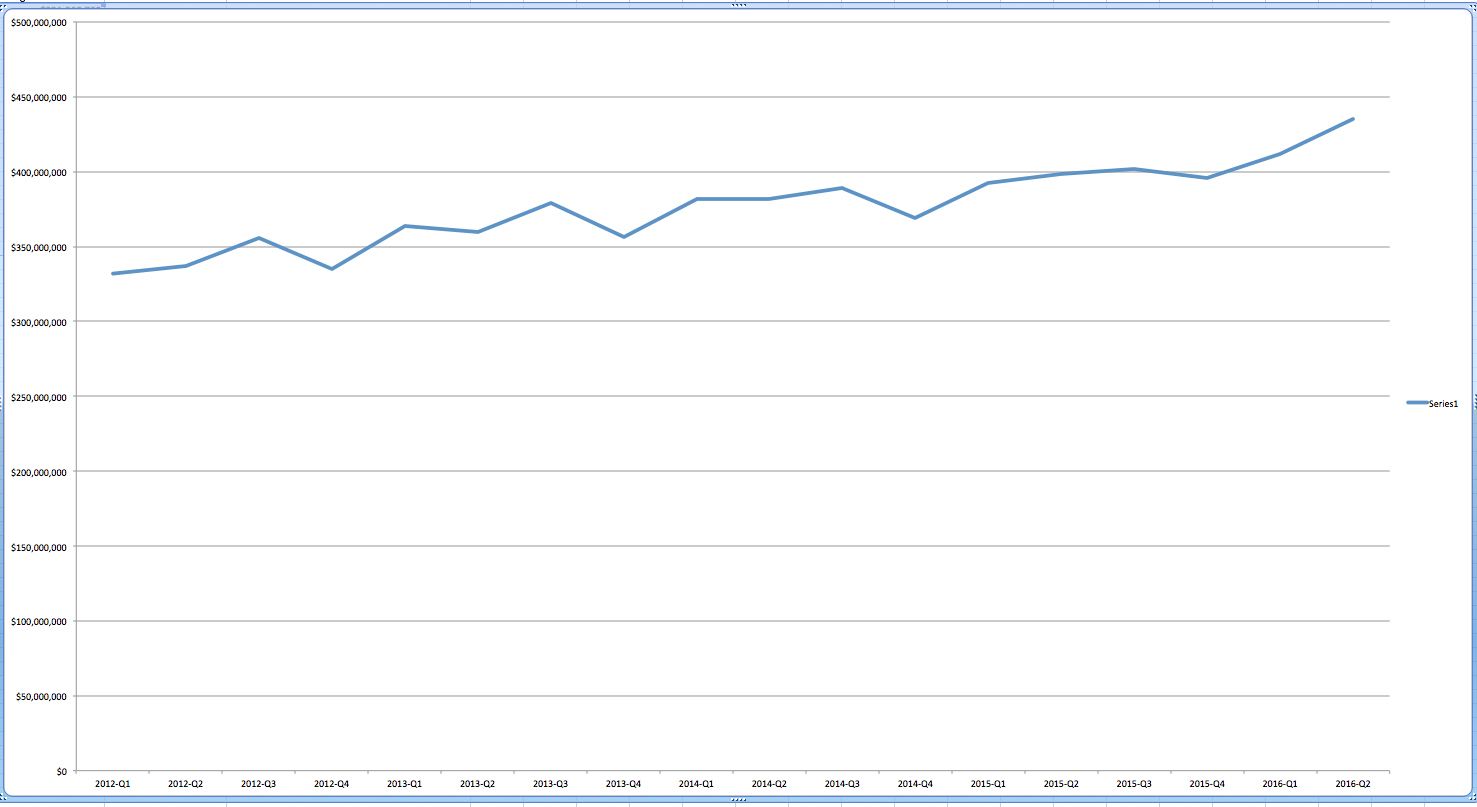
Average inventory reported per filer, however—that’s a much more pronounced trajectory. Average inventory jumped 31.1 percent, from $331.9 million per filer at the start of 2012 to $435.4 million by second quarter 2016. (See Figure 2, below.)

Total inventory might be see-sawing slowly upward. Average inventory is much more on a steady march.
That said, drawing conclusions from the aggregate data here is somewhat dicey. Corporations build up inventory for all sorts of reasons; if you want to find omens of economic health, you’ll be on much firmer ground if you examine inventory fluctuations within one specific business sector and keep your predictions confined to that group.
Calcbench will try to do that more granular analysis in future posts but for now, that’s how the big picture looks for inventory levels: big, and getting bigger by the quarter.