One of the great immovable forces in Corporate America is, of course, overhead costs. So as we sat around Calcbench headquarters the other day, wondering what interesting facts we might find in our databases, we said: “Hey! Let’s look at trends in SG&A costs (sales, general, and adminsitrative) over time to see how they’re changing!”
That research is easy enough to do. You can do those broad analyses from our Data Query Page; SG&A costs are a choice you can select from the list of items on the income statement. We decided to look at SG&A costs (total for all public filers, and average amount per filer) for 2011 through 2015. Easy enough.
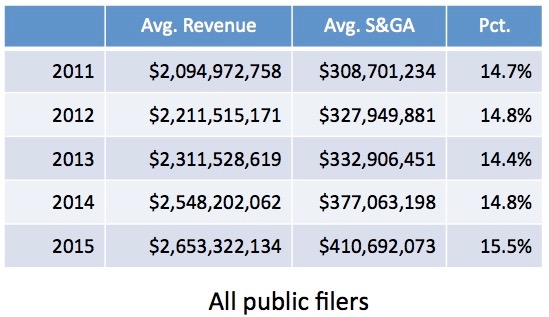
In fact, we thought, that’s too easy. So we also collected total and average revenue for the same period, and then calculated the percentage of total revenue spent on S&GA costs per filer. You can see the results below, in Figure 1.

That’s a remarkably steady range for SG&A costs as a portion of total revenue until we hit 2015, when the figure jumps from 14.8 percent to 15.5. You might recall that earlier this year the Labor Department said wages finally began rising again in 2015, and that’s reflective of these numbers. We’ll be curious to see what 2016 numbers look like when they are reported next spring, given the respectable wage and job growth we’ve seen all year long.
So we then decided to run the same analysis specifically for the S&P 500. Results are below in Figure 2. The percentages are higher, but still fluctuate within a narrow band.

Then just for kicks, we ran the same analysis specifically looking at filers from the banking and securities trading sectors—jobs where sales commissions can be much higher. Lo and behold, SG&A costs were much higher, although again within a narrow range. See below in Figure 3.
