One year ago, when we last looked at exchange rates for the U.S. dollar and how they affect corporate cash flows, the news wasn’t terribly thrilling.
From 2011 through 2015, the dollar had risen 30.6 percent against a basket of other major currencies— and that rise had been accelerating, as the U.S. economy kept gathering steam and the Federal Reserve started raising interest rates at the end of 2015.
For global companies, those currency exchange fluctuations can cause various headaches. Typically they are reported on the Statement of Cash Flows, as “effect of exchange rate on cash.” We reviewed the effect of exchange rates among the S&P 500 for 2011 through 2015, and the rising dollar steadily chewed away their collective cash pile: cutting into it by 2.36 percent in 2015 alone.
So, with all 2016 annual reports now in hand, where are we?
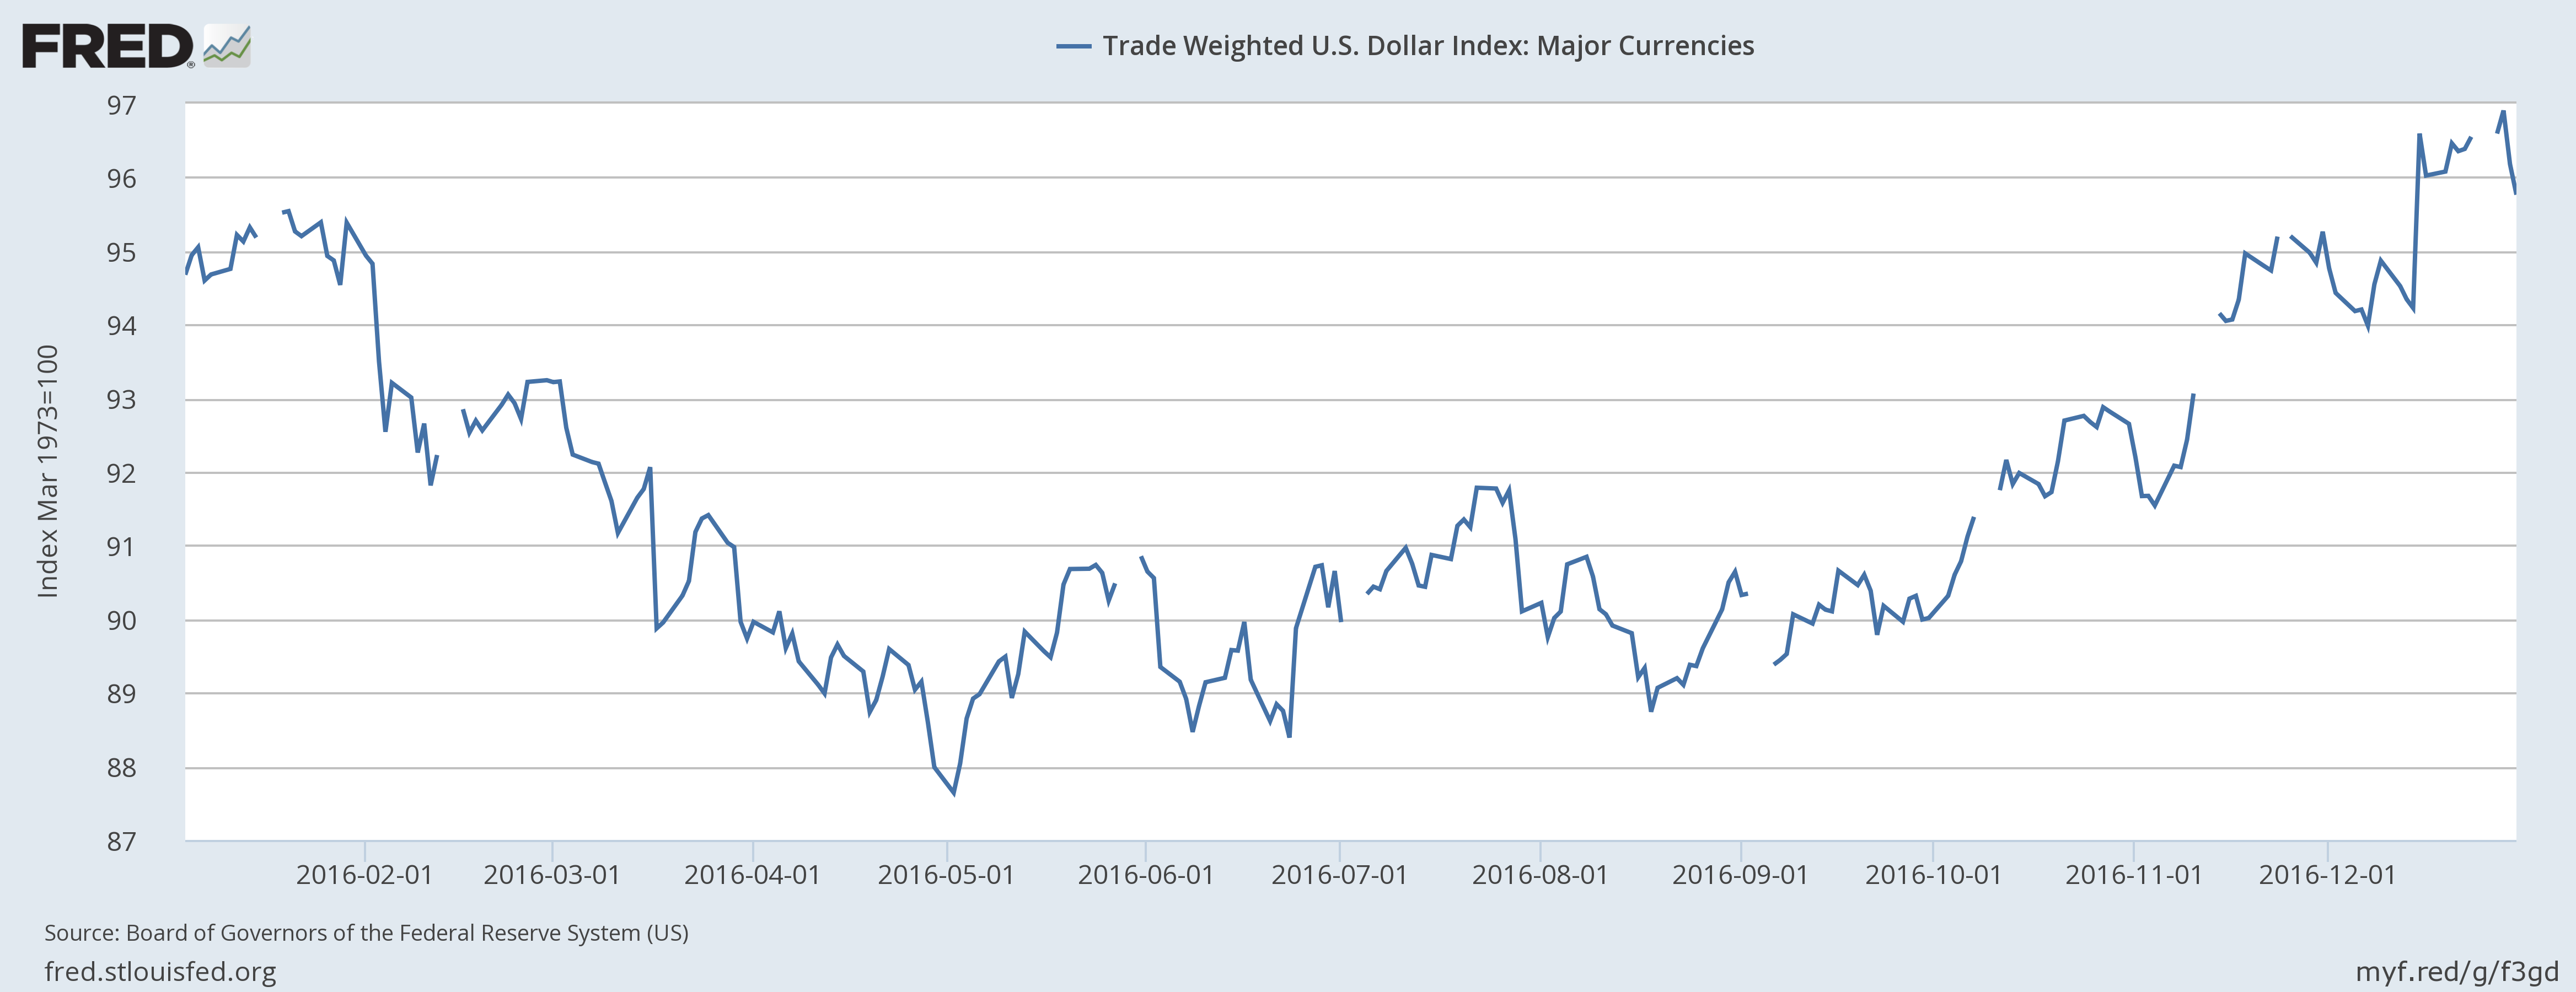
Alas, the dollar teetered and tottered in 2016. According to FRED (the Federal Reserve Economic Data), the dollar began 2016 valued at 94.676 cents against a basket of major trading currencies. It hit a low of 87.64 by May, as people realized the Fed wouldn’t be raising rates as briskly as hoped; and closed the year at 96.18 as Wall Street hoped an incoming Trump Administration would jolt the economy into overdrive.
The 2016 dollar fluctuations are below.

What does that mean for cash flows, and cash in company coffers? To determine that answer, we visited our trusty Data Query Tool, and then pulled “Cash and Equivalents” plus “Effect of Exchange Rate on Cash” for 2012 through 2016. The table below shows what’s going on.
| Total Cash and Equivalents | Total Currency Ex. Effects | Pct. Change | |
|---|---|---|---|
| 2012 | $1,424,439,480,000 | $2,274,592,000 | 0.16% |
| 2013 | $1,504,777,935,000 | -$11,792,726,000 | -0.79% |
| 2014 | $1,485,769,505,000 | -$38,574,317,000 | -2.67% |
| 2015 | $1,531,117,096,000 | -$35,246,394,000 | -2.36% |
| 2016 | $1,505,827,580,000 | -$14,020,768,000 | -0.94% |
In other words, after several years of appreciation, the dollar kinda stalled out in 2016— and that led to a sharp deceleration in how much the exchange rate effects chewed up cash. Yes, the cash was still chewed, but at only -0.94 percent. That’s much better than 2015 and 2014.
Two points, for anyone doing the math at home.
First, the total cash is already adjusted for currency effects. To measure the percent change, therefore, we need to add back the currency adjustment to the total, to get an unadjusted amount— and then calculate the percentage. Second, you’ll notice our numbers for prior years in this chart differ slightly from amounts we calculated one year ago. That’s because some companies revised numbers during the last 12 months. So the exact totals are different, but not to any material amount.
What does that help us deduce about 2017? Well, so far this year the dollar has gone nowhere but down, to a low of 86.232 as of Sept. 8. That’s largely due to the Trump Administration not yet delivering any promised tax reform, and the Federal Reserve not pursuing interest rate hikes with vigor and zeal. Plus other major world economies are growing more strongly now, too, so the dollar has some rivals again.

Mark your calendars for September 2018, and we’ll see how that above paragraph turned out.