The other day we were skimming recent SEC comment letters to firms asking about their financial filings (because that’s what we do for fun around here), when we came across one exchange between the SEC to Procter & Gamble ($PG).
The SEC had asked Procter & Gamble about the company’s supply chain finance program, where P&G was working with one of its banks to extend payment terms with P&G suppliers. That financing program had $1.9 billion to P&G’s cash flow over the course of 2018, but also stretched its Days Payable Outstanding metric by eight days.
The SEC was curious about that change in “DPO” and wanted more detail from Procter & Gamble about how the program works. It also asked P&G to consider (read: carry out) expanding its liquidity disclosures, in case any contraction in supply chain financing — which P&G said might happen in fiscal 2020 — would have a material pinch on financial statements.
Honestly, most of the exchange is arcane stuff. But the SEC’s question about longer Days Payable Outstanding did catch our eye, because Calcbench can easily benchmark those changes in one company or among many.
First, for those unfamiliar: Days Payable Outstanding is a common metric of efficiency, that measures how long a firm takes to pay its suppliers. You calculate it by dividing accounts payable at the end of a period into “purchase/day,” which is cost of goods sold for the year divided by 365.
And we have all that data in Calcbench.
You can find DPO in two ways. First, go to our Multi-Company Page and search “Days Payable Out” in the standardized metrics field on the left. (You do not want “Days Sales Outstanding,” which is something totally different.)
Or you can visit our Data Query Tool, which lists all sorts of data points you can research. DPO is one of the liquidity ratios listed at the bottom. Set the group of companies you want to research at the top, check the DPO metric at the bottom, and you can export the whole data file to Excel instantly.
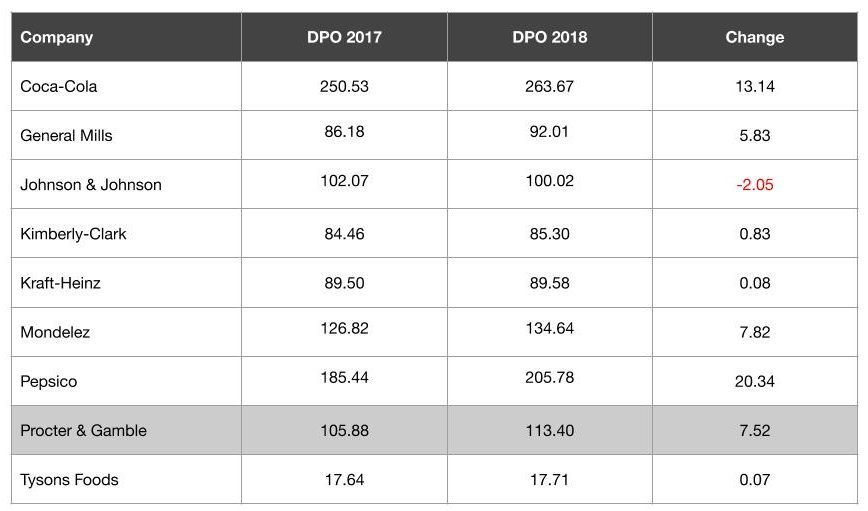
Anyway, back to Procter & Gamble. We wondered whether extending its DPO by eight days was highly unusual. What was the change in DPO among its peers? Among the S&P 500 generally? So we ran the numbers for DPO in 2017 and 2018, and totaled up the difference.
As you can see from Table 1, below, P&G’s extra 7.52 days in Days Payable Outstanding isn’t anything unusual among its peers.

That’s one benefit for companies using Calcbench: you can pull up benchmark data quickly, and use that to buttress whatever reply you want to submit for an SEC comment letter. Arguments based on logic and theory can work, but arguments based on data work better.
Analysts, meanwhile, can use Calcbench to verify what companies are saying in the filings. You can compare the company you follow to its peers, and across reams of data points you can get a better understanding of what “normal” really looks like.