Coronavirus has put Wall Street through a tornado of volatility this week. That’s going to drive up the importance of astute financial analysis, as people examine the balance sheets and cash-flows of airlines, hotels, travel businesses, and other firms affected by the virus.
Calcbench has many ways to study those things. Today we want to focus on one item crucial to that analysis: debt.
After all, for the hardest-hit companies, liquidity could become an issue within the next quarter or two. Stockpiles of cash can be great, but if a firm only has lots of cash because it did a bond issue a few years ago and those payments are coming due — that’s less great. It’s about what bills are coming due soon, and where you can access cash to meet those obligations.
We decided to poke around annual filings of the airline industry to get a sense of things.
You can find a company’s disclosures about debt by going to our Interactive Disclosures page, pulling up their most recent filing (for most airlines right now, that’s their Form 10-K for 2019), and selecting the “Debt” option from our pull-down menu of disclosures on the left side of the page.
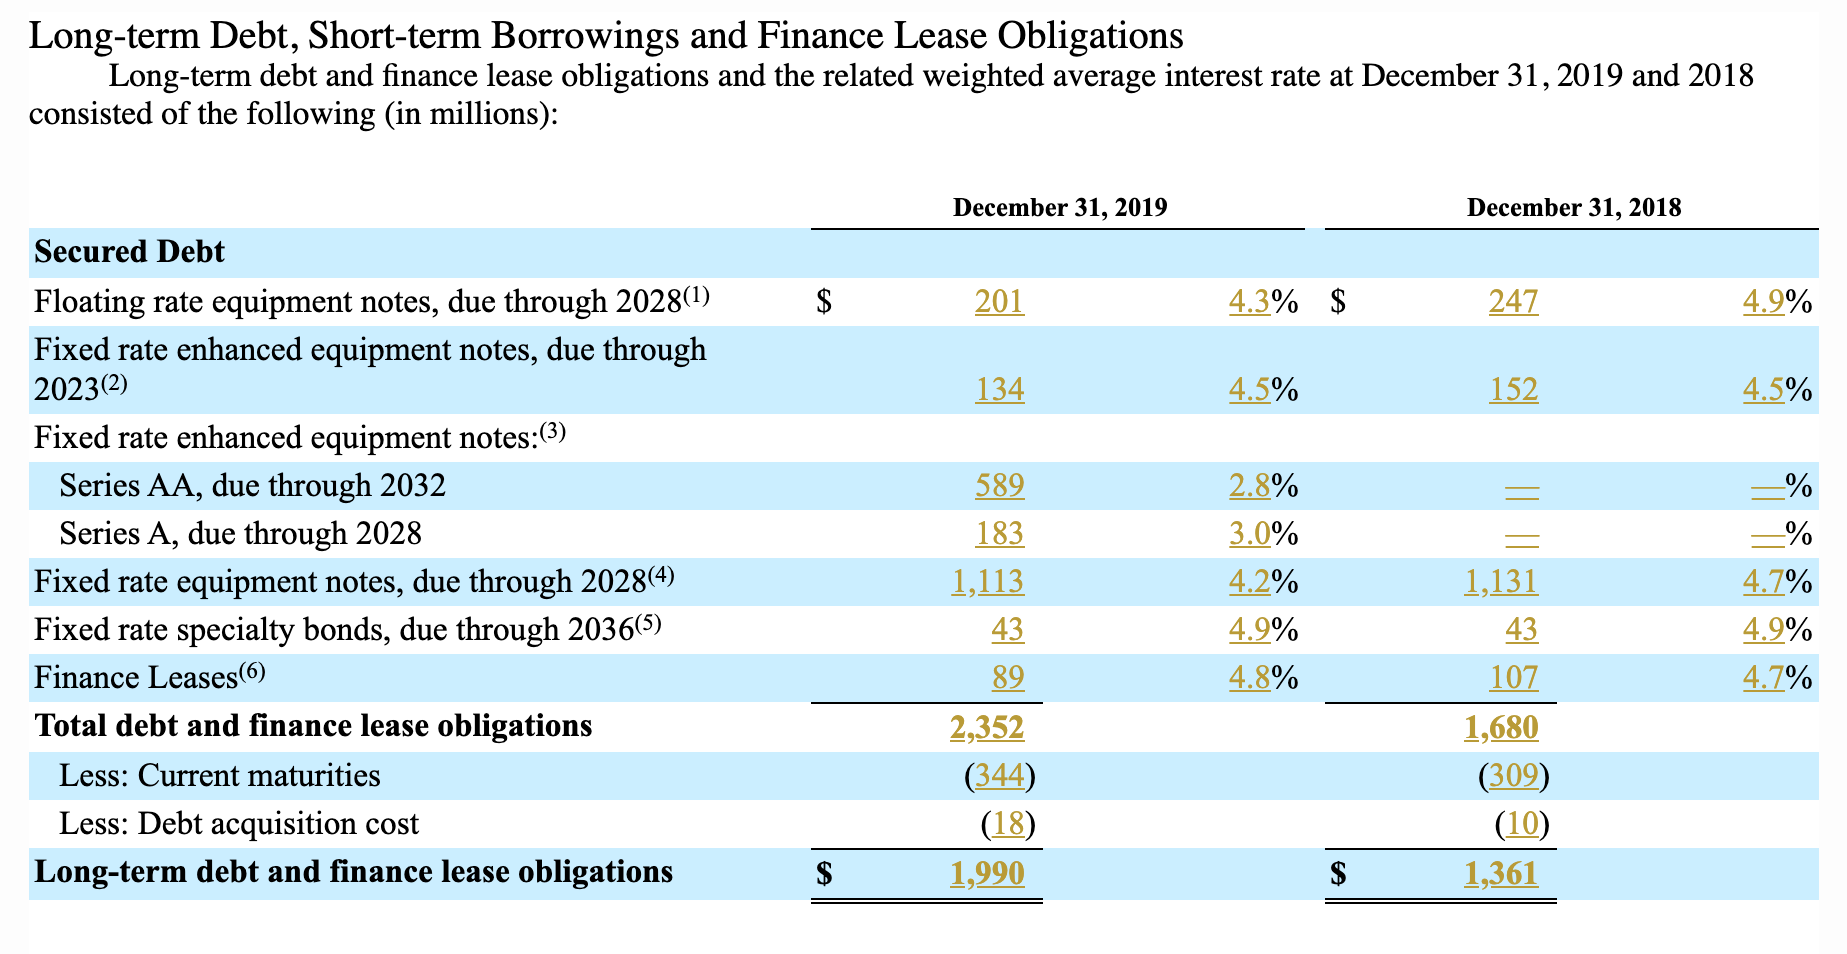
We started with JetBlue $JBLU. The company reported $1.99 billion in long-term debt and finance lease obligations for 2019, up 46 percent from $1.36 billion the year prior. Most of that debt is long-term notes due anywhere from 2023 to 2036, with interest rates from 2.8 to 4.9 percent. See Figure 1, below.

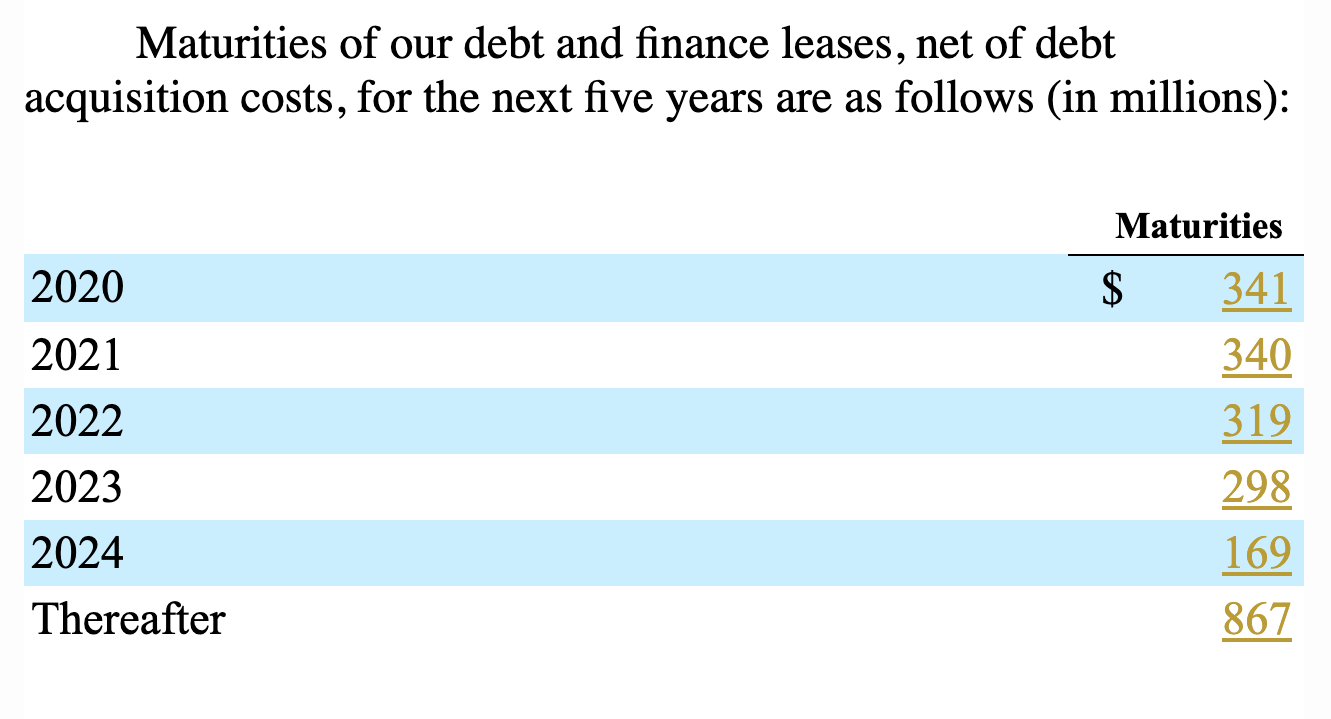
JetBlue also reports the amount of long-term debt maturing in each of the next five years, plus all future debt thereafter. See Figure 2, below.

You might be thinking, “Wait — those annual debt maturities add up to $2.334 billion, not the $1.99 billion you just mentioned. What gives?” That’s because the annual breakdown includes $344 million in current debt. Subtract that amount from $2.334 billion and you land at $1.99 billion.
Those points of data are a good start, but you might also want to see how these line items compare to JetBlue’s peers. You can do that by using the Multi-Company page to compare JetBlue to its peers for those specific line items.
We held our cursor over the $2.352 billion to see the exact XBRL tag JetBlue used for this item: LongTermDebtAndCapitalLeaseObligations. Then we copied that tag to search for it in the Multi-Company page.
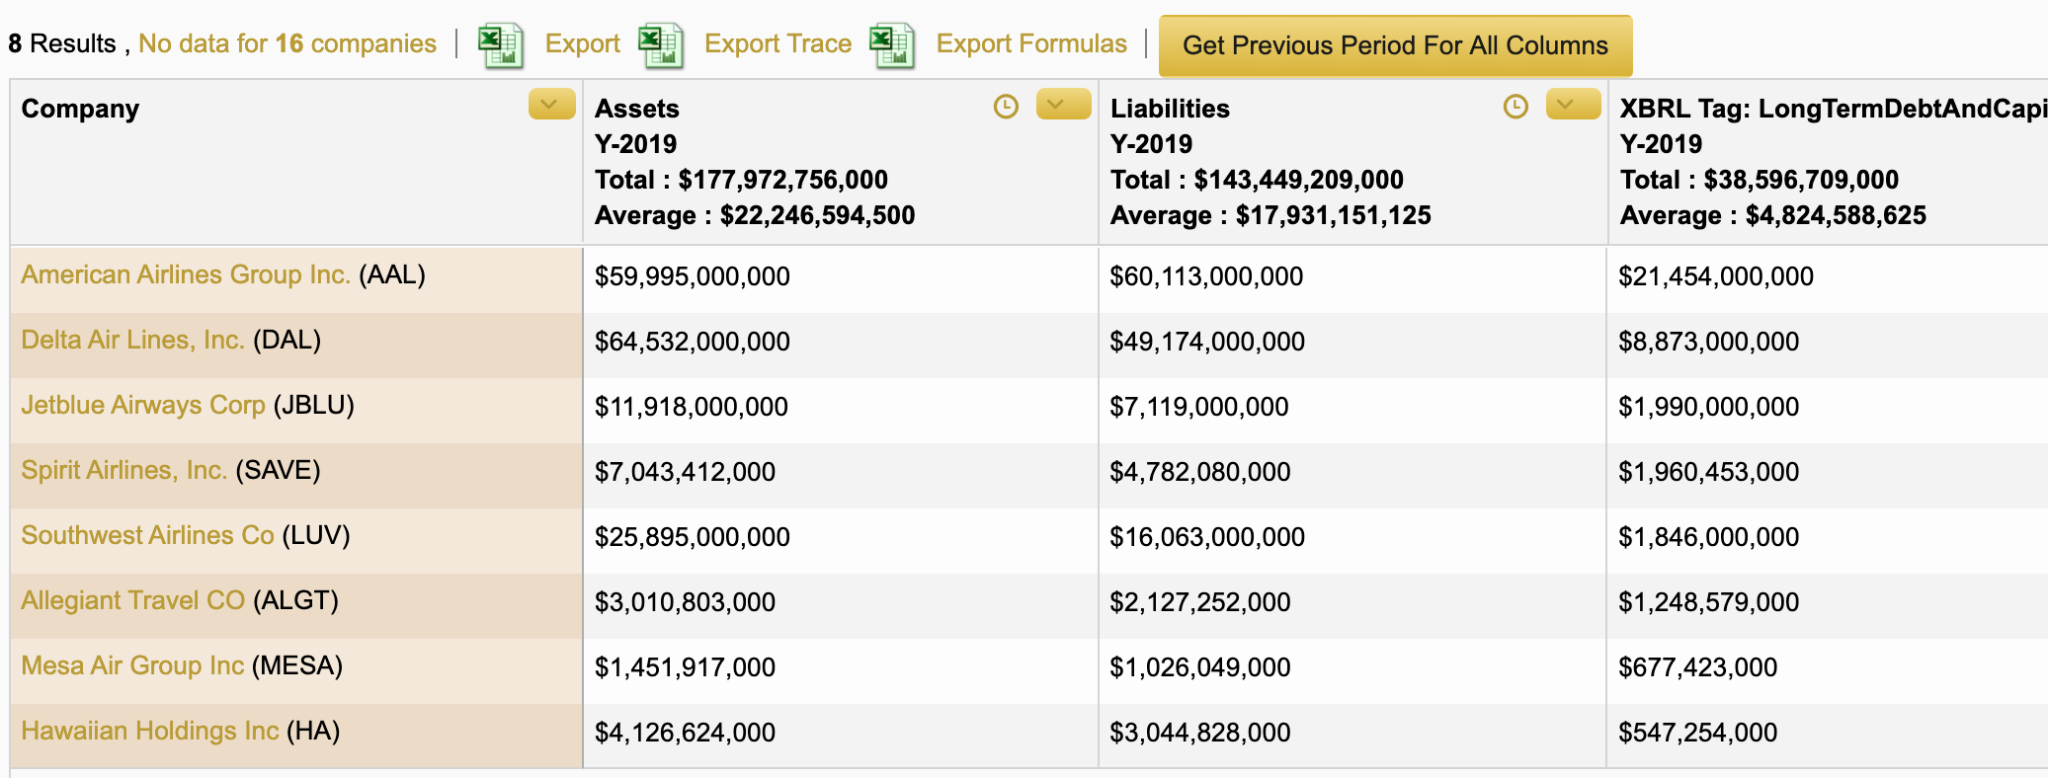
Figure 3, below, shows the results for eight airlines.

From there you can start to do some quick analysis, perhaps exporting to models in Excel you already have. But for example, we can see that long-term debt is a significantly larger portion of American Airlines’ $AAL liabilities (35.7 percent of total liabilities, versus 28 percent for JetBlue), while American’s assets are actually less than liabilities. At least for JetBlue, assets equal 167 percent of liabilities.
Meanwhile, we can also see that Southwest’s $LUV long-term debt is only 11.5 percent of total liabilities, and assets equal 161 percent of liabilities.
So with a few keystrokes, you can quickly start to find critical data about long-term debt totals and maturity dates; and how those numbers for one company compare to those of its peers.
We’ll be doing much more on ways to analyze the strength of balance sheet and operations as the economic uncertainty continues. Suffice to say that if the data is getting reported somehow, Calcbench has it, along with the database tools to find it.