We continue our look at the retail sector this week with a review of an important performance metric for this sector: inventory turnover.
Inventory turnover measures how many times a company has sold and restocked inventory during a given period. More simply: it measures how quickly a retailer is moving goods off its shelves. Generally speaking, the higher the number, the better.
Coronavirus has hammered operations for large retailers, with store closures, supply chain disruptions, and a recession that has left millions of consumers with fewer dollars to spend. So we wondered: have those forces shown up in inventory turnover?
We reviewed two years’ worth of quarterly filings among 40 large retailers — from Abercrombie & Fitch ($ANF) to Walmart ($WMT), with lots more high-profile brands in between — to see what we could find.
The short answer is: drawing broad conclusions about the whole sector is messy. Financial analysis will need to do a firm-by-firm review to see what’s really going on.
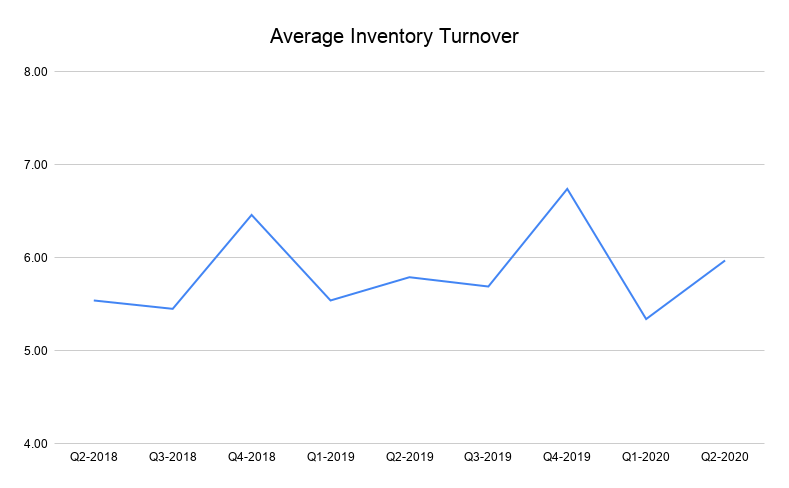
Figure 1, below, shows average inventory turnover among our 40 sample retailers for Q2 2018 through Q2 2020.

The zig-zag nature of this chart shows how much inventory turnover in the retail industry depends on the specific quarter. For example, inventory turnover is typically higher in calendar Q4 because that’s holiday season, when retailers design their operations to churn out sales as quickly as possible.
What struck us was the low inventory turnover for Q1 2020 — an average of 5.34, and a median of 3.61; compared to 5.54 and 3.99 in Q1 2019. Then note the sharp rebound in Q2 2020, to levels above Q2 2019.
That makes sense; if stores were suddenly closing earlier this year in Q1, sales would stall. Then stores reopened in Q2, and perhaps pent-up demand led to a spike in buying.
Then again, those are just broad averages across 40 firms. When you look at specific retailers to see how inventory turnover has fared this year, a more varied picture emerges. Numerous firms saw their inventory turnover decline from Q1 to Q2, meaning their ability to get goods off the shelves slowed. See Table 1, below.

Meanwhile, we also have several firms whose inventory turnover jumped from Q1 to Q2, which implies that they were selling inventory more quickly. (Either that, or increasing turnover can also suggest challenges with insufficient inventory.) See Table 2, below.

What’s interesting here is that Apple ($AAPL) and Casey’s General Stores ($CASY) have markedly higher inventory turnover to begin with. For Apple, that probably is a manifestation of the firm’s e-commerce prowess: you can jump online, place an order, and within a few days your iWhatever is at your doorstep. (We wrote about the importance of e-commerce in our previous Retail Week post.)
Casey’s, meanwhile, sells small-dollar items that people need all the time. Perhaps it’s little surprise that other firms with lots of convenience items — CVS Health Corp., Rite Aid, and Walgreens Boots Alliance, for example — all have inventory turnover well above 10, too.
Choose Your Own Metric
Calcbench subscribers can research inventory turnover and several other notable performance metrics themselves. We have a few options for you.
First, you can use the Multi-Company database page. Create the peer group of companies you want to research, and then enter any of several performance metrics we track in the “Standardized Metrics” field in the upper left portion of your screen. You might want to track:
- Inventory turnover, discussed above
- Days inventory held, a somewhat more sophisticated measure of how much time a firm needs to turn inventory and goods-in-progress into sales
- Days Sales Outstanding, which measures how quickly a company can collect on payment after a sale is made
- Days Payable Outstanding, which is a ratio to estimate how long a company needs to pay its own bills
You can also find these metrics on our Bulk Data Query page, which lets you research all sorts of data for large groups of firms — either individually or as a group; including by average or total amounts. Performance and liquidity metrics are listed at the bottom.