The Calcbench research department is back to non-GAAP financial metrics again, this time with a report analyzing how firms in the S&P 500 reported their adjusted earnings — and which adjustments accounted for the largest gaps between GAAP and non-GAAP.
You can download the complete report from the Calcbench Research Page. Meanwhile, here are some of the highlights.
What We Did
First, we examined the 2020 earnings releases of all S&P 500 firms that reported both GAAP and non-GAAP net income numbers. We measured the difference (in dollar terms) for the 60 firms with the largest differences between GAAP and non-GAAP net income.
We then counted the number of adjustments those 60 firms made, and grouped all those adjustments into 11 broad categories. Then we studied the size of each non-GAAP adjustment (in dollar terms) for those 11 categories.
The three big conclusions we found:
- Non-GAAP net income reported by our sample group exceeded GAAP net income by $132.3 billion. This is more than doubling total reported GAAP net income of $130.7 billion.
- The sample group made more than 240 adjustments to GAAP net income.
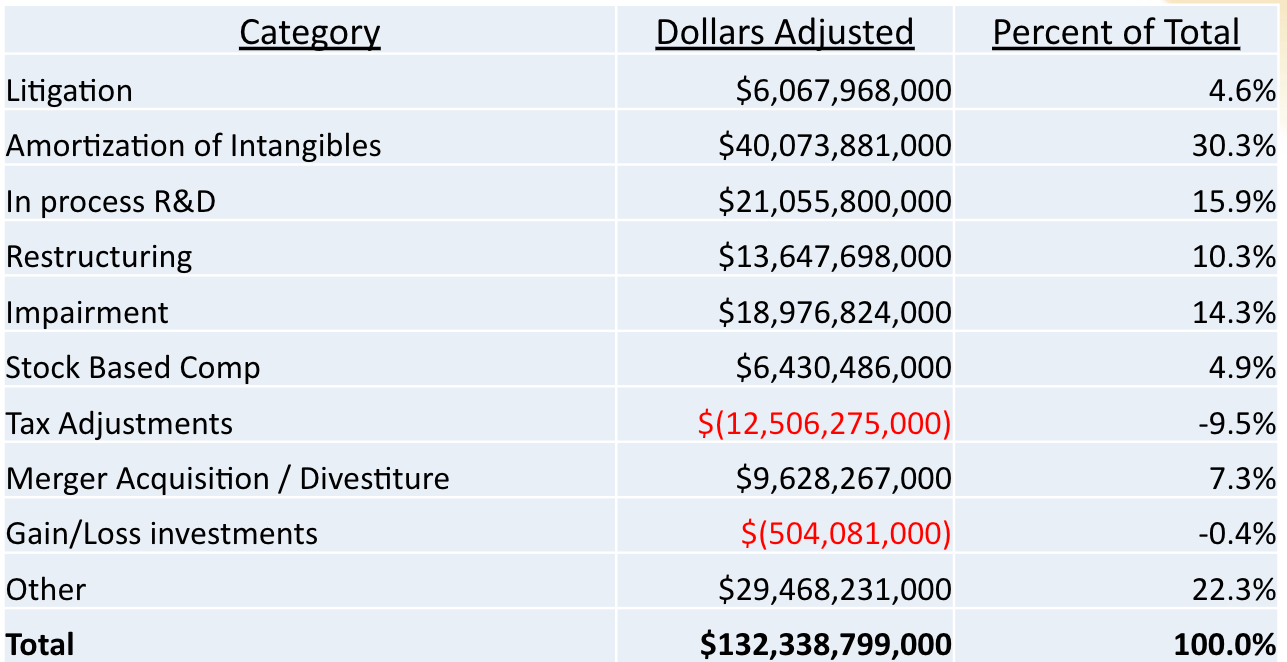
- Amortization of Intangibles was the single biggest category of specified adjustments, accounting for 30 percent of all adjustments.
The breakdown of adjustments across all 11 categories is in Figure 1, below.
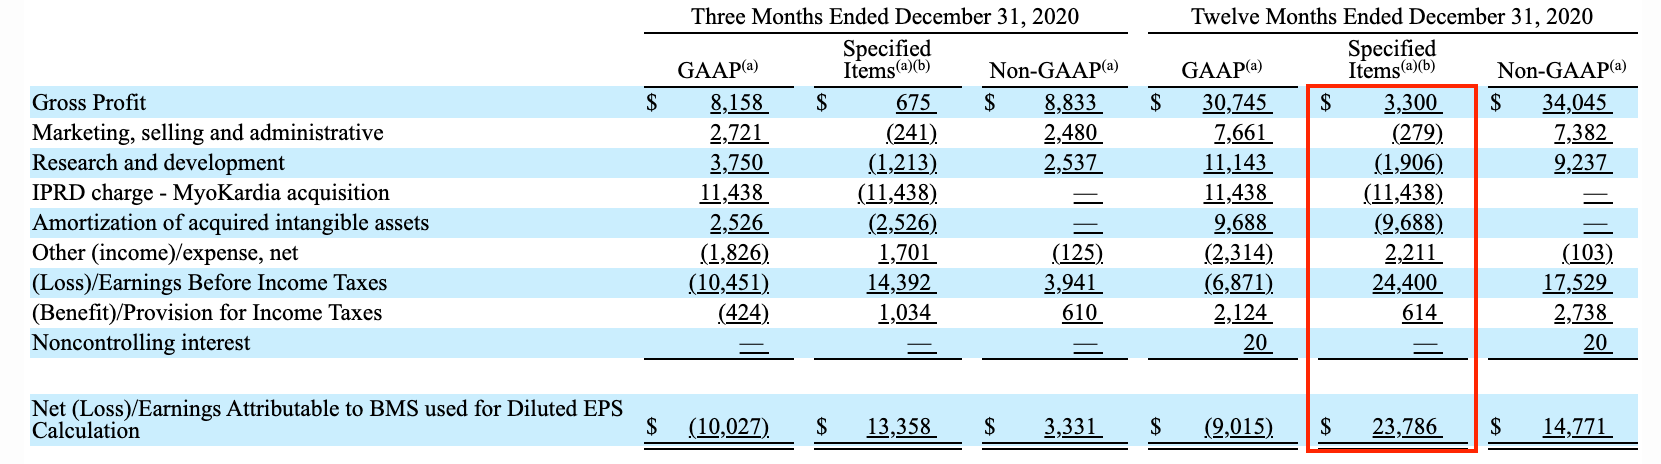
A good example of the adjustments comes from Bristol Myers Squibb ($BMY). The company reported a $9 billion loss for 2020, and then added back another $23.78 billion in various adjustments — for a non-GAAP adjusted net income of $14.77 billion. See Figure 2, below. The column with the adjustments is boxed in red.
And an Other Thing...
We’d be remiss if we didn’t note that 22 percent of the non-GAAP adjustments we tracked fell into the ever-popular “Other” category, accounting for $29.47 billion. What are those Other adjustments? Who is making them?
We looked deeper. Turns out, 75 percent of that amount can be explained by just four firms:
- AmerisourceBergen ($ABC) and AbbVie ($ABBV) both had “contingent considerations” of more than $5 billion each.
- UPS ($UPS) had an almost $5 billion mark-to-market loss on its defined benefit plan.
- Hess ($HES) has $2.1 billion in exploration costs.
Our report has numerous other examples of firms and their non-GAAP adjustments, including examples of revised non-GAAP numbers that change when a firm’s reconciling items change. So download the full report, and let us know what you think!