By Jason Apollo Voss, CFA
This month we begin a two-part series on the importance of examining long-term finance receivables when evaluating a firm’s revenues to see if there is a “there” there — that is, to assure yourself that, yes, a firm’s revenues are reliable.
An Ancient Case Study: Motorola
Let me take you back to the heady days of the dot-com era, roughly from 1998 to 2000. Many newly minted web-based companies received exorbitant valuations, measured however you want to measure it. This was especially true when compared with older tech companies such as Xerox, IBM, or Motorola.
In 1999 I was invited to Motorola headquarters in Schaumburg, Ill., by my fellow research folks at the mutual fund where I served as a portfolio manager. On short notice, I was invited along for a second opinion about Motorola. This was a big deal because we were among its largest shareholders. We had to get the Motorola story right or lose big for our investors.
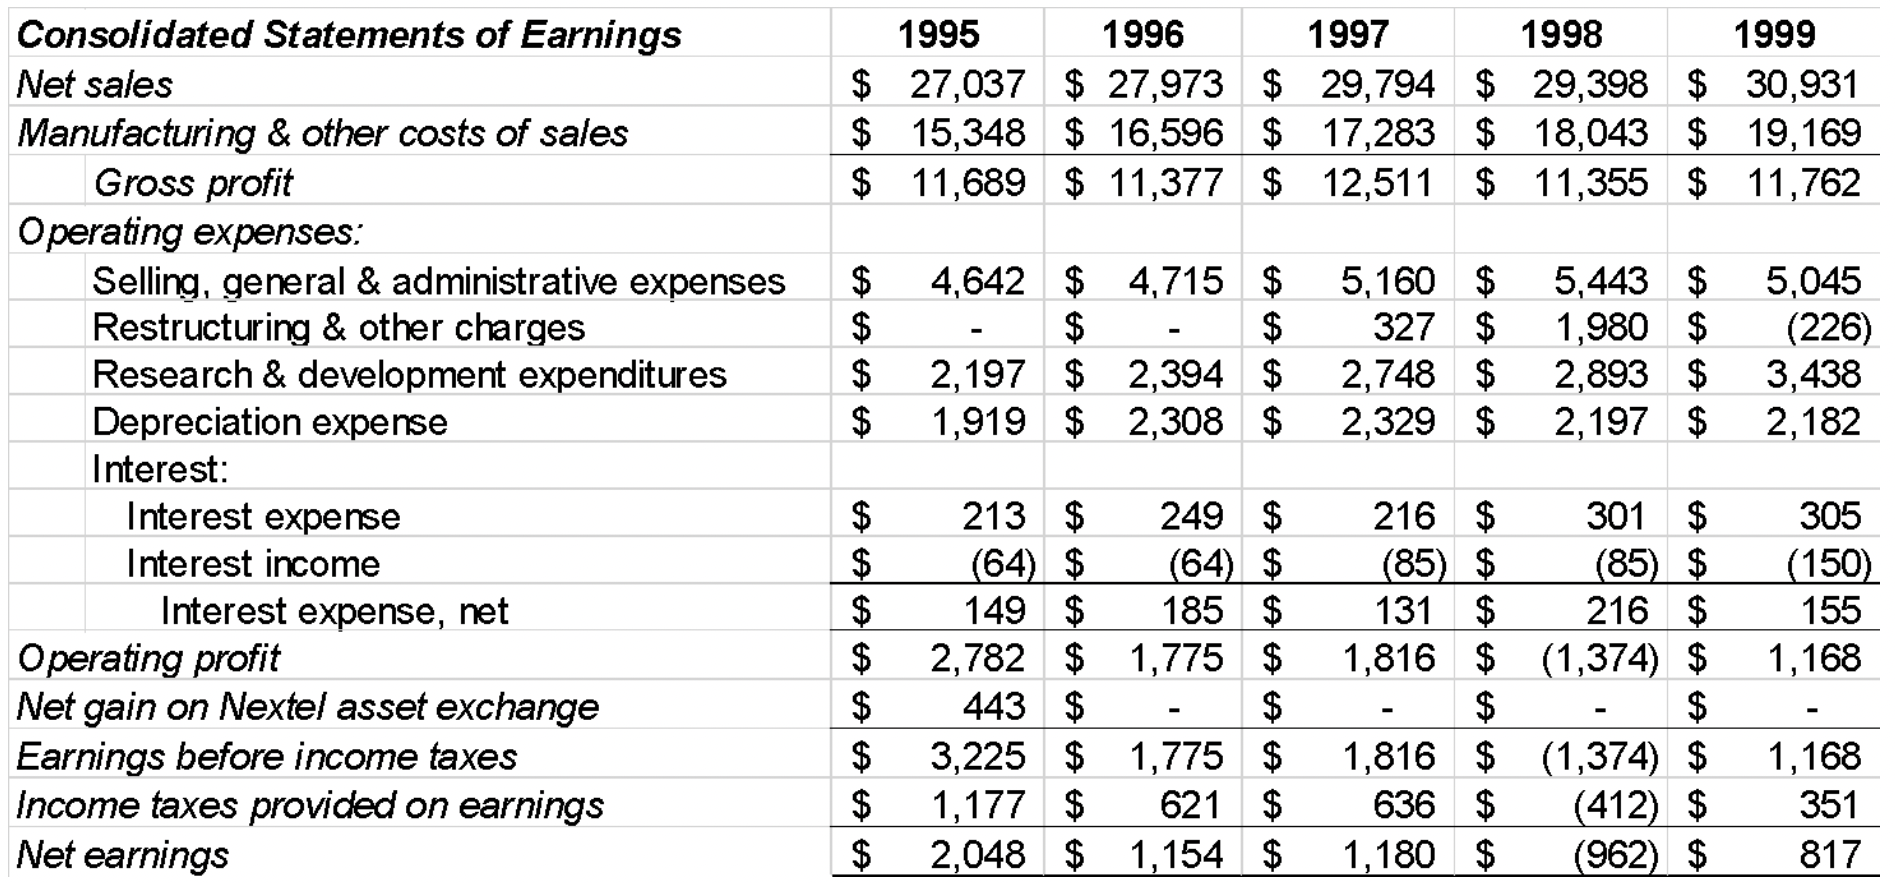
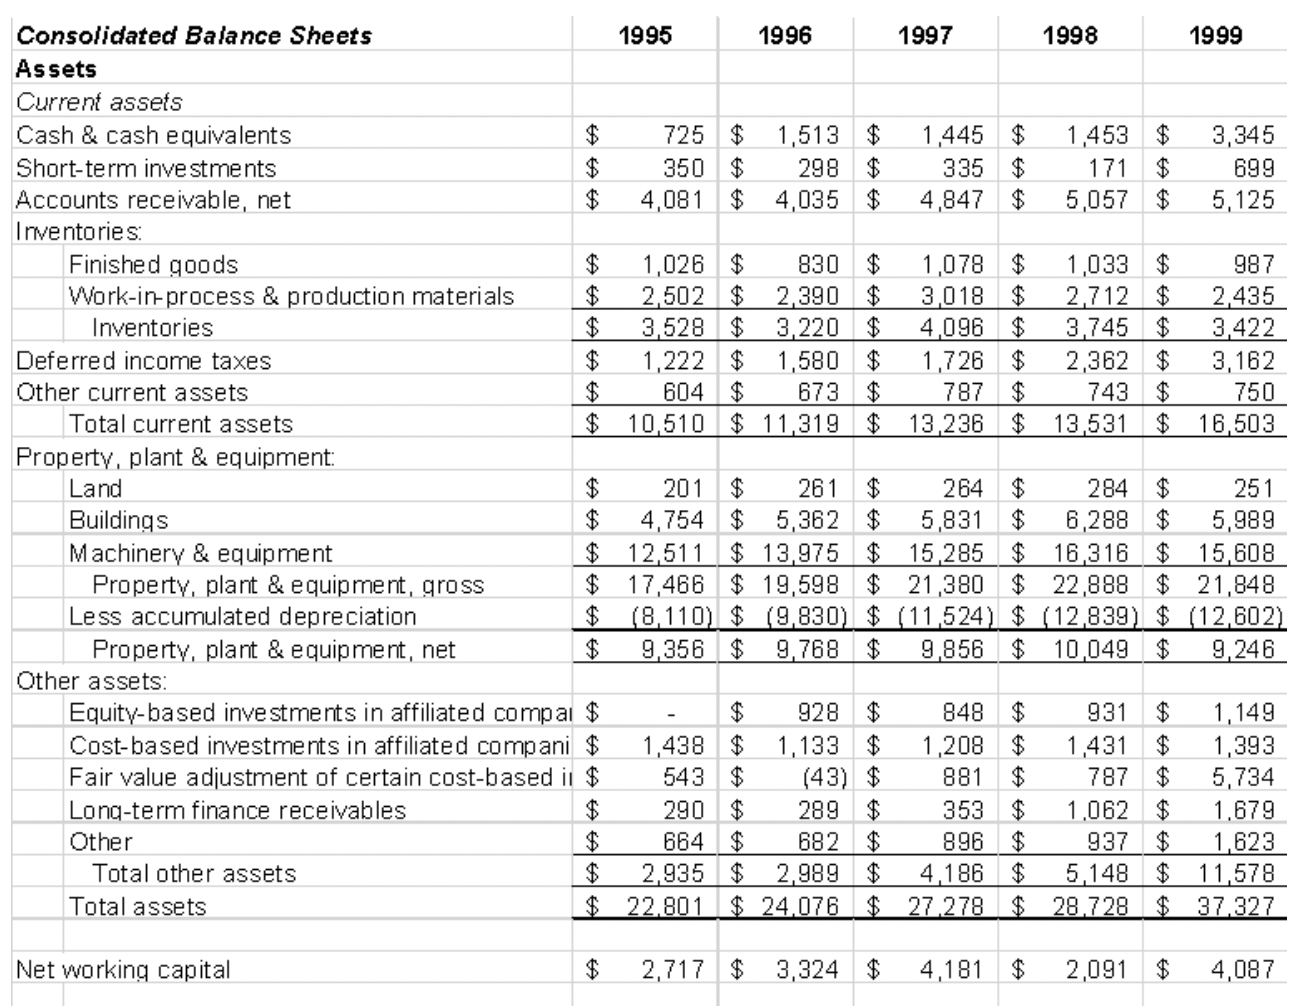
I conducted my usual financial statement analysis and discovered something disconcerting. Here, for convenience, are Motorola’s Consolidated Statements of Earnings and Consolidated Balance Sheets for 1995 through 1999:


Back before the days of Calcbench, I had to hand-enter this data to get all of the detail you see above. For example, look at all of that property, plant, and equipment granularity! I also calculated common-size statements over both revenues and assets.
Context is King!
Another thing I did to extract information was to look at the growth rates in different accounts. This tends to reveal the on-the-ground reality of a business much better than a management team’s narrative about its performance. Why? Because if some balance sheet accounts were growing way faster than revenues (as was the case with Motorola) this tells a research pro what is or isn’t hot in the real world operating context of the firm.
In Motorola’s case, accounts having to do with market-based investments, and a category of asset labeled “Long-term finance receivables,” were growing very fast relative to revenues. It made perfect sense that Motorola’s “Short-term investments,” “Fair value adjustment of certain cost-based investments,” and “Contributions to employees’ profit sharing funds” would be growing so fast, because the stock market was in full rocket ship mode at the time. So, these I could dismiss as not being interesting because this outcome was in alignment with expectations. Context is king!
That understanding of context, however, also led to my deep concern about Motorola’s growth in “Long-term finance receivables.” At that moment in history, Motorola was perceived as “your grandparent’s technology company.” Its products were seen as not up to par with those offered by the powerhouses like Cisco Systems, for example. Its customers included other old lion companies, and even (gasp!) the U.S. government. In other words, Motorola had an incentive to look current.
Motorola’s Image: There is no there, there
Let us return back to those “Long-term finance receivables” of Motorola’s. What the heck are those?
“Long-term finance receivables” are typically extensions of credit to customers, so the customers can buy the company’s products.
Automobile companies do this all the time. They frequently serve as both lender and seller (of the car) to their customers. In so doing, they capture value in interest payments that otherwise would be surrendered to financial institutions. Serving as lender to customers also allows the automakers to sell cars at a discount, because they know that they will more than recoup the price discount via interest payments. All well and good.
So, what troubled me about Motorola’s “Long-term finance receivables?” The following:
- The compound annual growth rate of “Net sales” 1995 through 1999 was 3.42 percent.
- The compound annual growth rate of “Long-term finance receivables” 1995 through 1999 was 55.12 percent.
- “Long-term finance receivables” was not even a reported category in 1995. Instead, its value had to be indirectly calculated based on a disclosure on a finance supplement attached to the company’s proxy statement. But its rapid growth rate when compared with “Net sales” (55.12 percent vs. 3.42 percent) clearly screamed that it was important to Motorola’s current operating environment and likely its financial performance.
- In 1998 and 1999 “Net sales” grew by $1.137 billion, while “Long-term finance receivables” grew by even more: $1.326 billion.
All these factors combined meant that one could argue that more than all of Motorola’s growth came from financing its customers. Clearly this wasn’t sustainable unless Motorola had access to some form of cheap financing of its own. Further, what if the creditworthiness of Motorola’s customers was not so good?
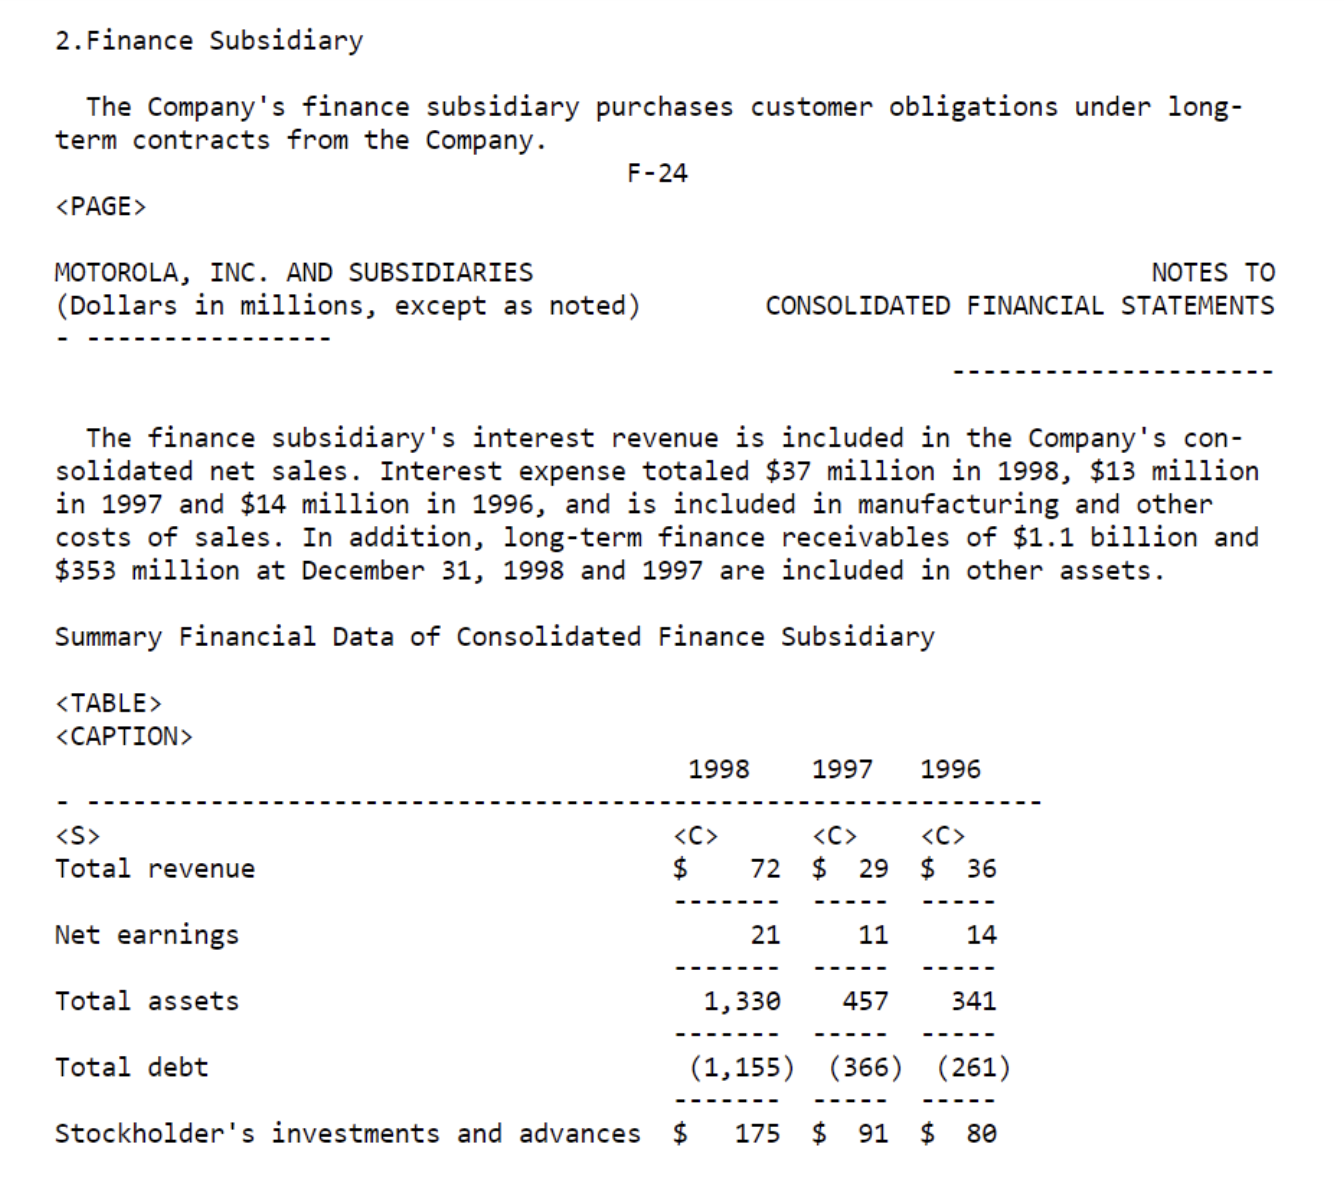
Motorola’s disclosure in both its 1999 and 2000 proxy statements (DEF 14A) about its “Long-term finance receivables” gives us even more color. Below is the disclosure from 1999.

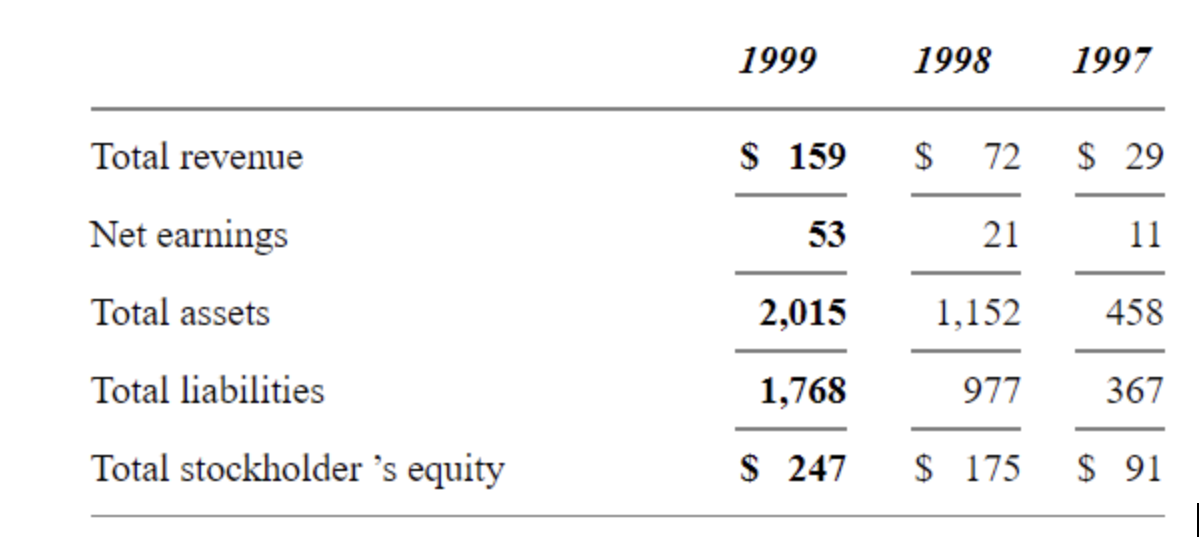
Here is the disclosure from Motorola’s 2000 proxy statement:
“Motorola Credit Corporation (MCC), the company's wholly owned finance subsidiary, is engaged principally in financing long-term commercial receivables arising out of equipment sales made by the company to customers throughout the United States and internationally.
“MCC’s interest revenue is included in the company’s consolidated net sales. Interest expense totaled $72 million in 1999, $37 million in 1998 and $13 million in 1997, and is included in manufacturing and other costs of sales. In addition, long-term finance receivables of $1.7 billion and $1.1 billion (net of allowance for losses on commercial receivables of $292 million and $167 million, respectively) at December 31, 1999 and 1998 are included in other assets.
Summary Financial Data of Motorola Credit Corporation”

From this information, I could calculate the implied interest rate being charged and compare that to market interest rates. For ’96 through ’99 the implied rates were: 4.11, 2.84, 2.78, and 3.57 percent, respectively. These rates were below market. (Calculation example for 1999: $72 million of “Interest expense” $2,015 million of “Total assets” = 3.57 percent.)
Recall from earlier that Motorola’s “Net sales” went down in 1998? Clearly it was easy to reject the thesis that the company may have been discounting prices, but making it up by collecting interest. Why? Because not only were sales down; the interest rate charged on those sales was below market.
My nerves would be calmed if Motorola were selling its products to creditworthy customers. After all, that would be exactly as the automobile industry has done for so long: find a way to be competitive on pricing, and also to make it up by financing.
So who were Motorola’s new customers according to its 2000 DEF 14A?
“Purchasers of the company’s infrastructure equipment continue to require suppliers to provide long-term financing in connection with equipment purchases. Financing may include all or a portion of the purchase price and working capital. The company also may assist customers in getting financing from banks and other sources. During 1999 the company significantly increased the amount of customer financing provided by its consolidated financing subsidiary. As a result of increased demand for customer financing, the company’s consolidated financing subsidiary borrowed more money in 1999. The company expects that the need to provide this type of financing or to arrange financing for its customers will continue and may increase in the future.”
Then a little later in the document we have:
“In the Networking and Computing Systems Group sales and orders increased as a result of the sales growth of key customers. In the Wireless Subscriber Systems Group sales increased and orders were significantly higher due to the rapid growth of the wireless telephone market, including sales growth within the company’s PCS segment, which is the group’s largest customer.”
And finally this frightening disclosure:
“Unbilled receivables which are included in accounts receivable but not yet billed to the customers were $737 million and $600 million at December 31, 1999 and 1998, respectively.”
In other words, relative to Motorola’s “net sales” or revenues, the company was extending credit to un-creditworthy customers. In exchange for near worthless IOUs from its customers, Motorola was sending product out the door.
Moreover, Motorola also had a gigantic proportion of its revenues that were “unbilled.” Umm, why? If product has been delivered, then why have customers not been billed? Whoa!
As I arrived in Schaumburg, guess which questions were top of mind for me?
- Who are your newest big customers?
- Are you throwing product at customers?
Motorola’s investor relations pro was only too pleased to communicate to us that the new and biggest customers were mostly wireless telecom companies. In other words, Motorola was just as hip as the dot-com newbies. What he did not realize was my shareholder horror at recognizing that these new customers were not cash flow positive, and were heavily leveraged.
So what trouble did Motorola get into later in 2000? You guessed it — defaults on the part of many of its new, sexy customers.
This scandal was a preventable surprise because the whole story was there for the diligent research analyst who can bridge the quantitative disclosure with a qualitative understanding of context. The analyst who can recognize when there’s no “there” there.
Conclusion
To wrap up, let us review the important considerations when examining long-term financing receivables:
- What is the current economic and operating context of the company
- Relative to revenue growth, what is the growth in long-term financing receivables? If much faster, is this a part of the company’s strategic plan
- What are competitors doing to generate new revenues, and what is the creditworthiness of the customers to which the company is selling?
Knowing the answers to these questions allows a research pro to evaluate the substance of a company’s revenues both today and tomorrow.
Next month we use the techniques shared this month to examine General Motors. We will add some new wrinkles, such as an examination of the Allowance for Doubtful Accounts. And because we use recent history in this next example, our analyses will make use of Calcbench’s cool tools!
This is a monthly column written by Jason Apollo Voss — investment manager, financial analyst, and these days CEO of Deception and Truth Analysis, a financial analytics firm. You can find his previous columns on the Calcbench blog archives, usually running the first week of every month.