For a while now, everyone has known that the Covid-19 pandemic scrambled business performance across the corporate landscape — with the general sense that larger firms have fared better, smaller firms worse.
Now we have some visual evidence of just how true that statement is.
As part of another project, the Calcbench research team was looking at the share of corporate revenues and profits that flowed to S&P 500 firms in recent years. We noticed, to no surprise, that the largest S&P 500 firms accounted for a disproportionate share of all S&P 500 revenue.
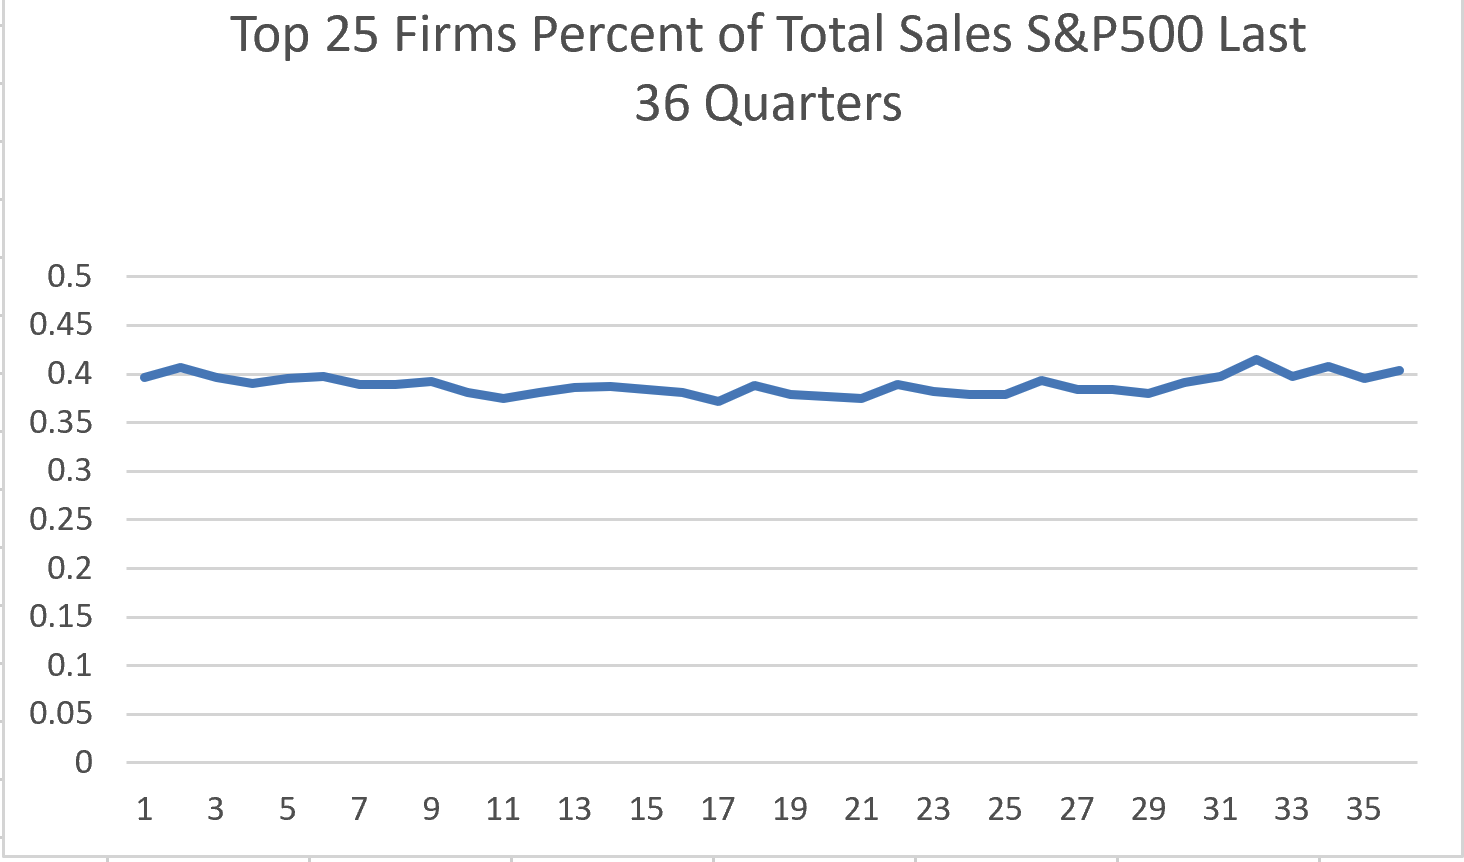
How disproportionate? Figure 1, below, shows what share of all S&P 500 revenue went to the largest 25 firms for the last 36 quarters.

That Top 25 share has stayed remarkably consistent year after year: from 40 percent in 2012, to a low of roughly 37 percent in the mid-2010s, to a high of 42 percent at the beginning of 2020 when the pandemic arrived.
That got us wondering. If revenue has been consistent among the 25 largest firms, what about the other 475? What churn have they experienced year after year?
So we ran another analysis. This one only looked at annual revenue and net income for the last nine years, but we grouped the S&P 500 into quintiles — the 100 largest, the next 100 largest, the third 100, and so forth.
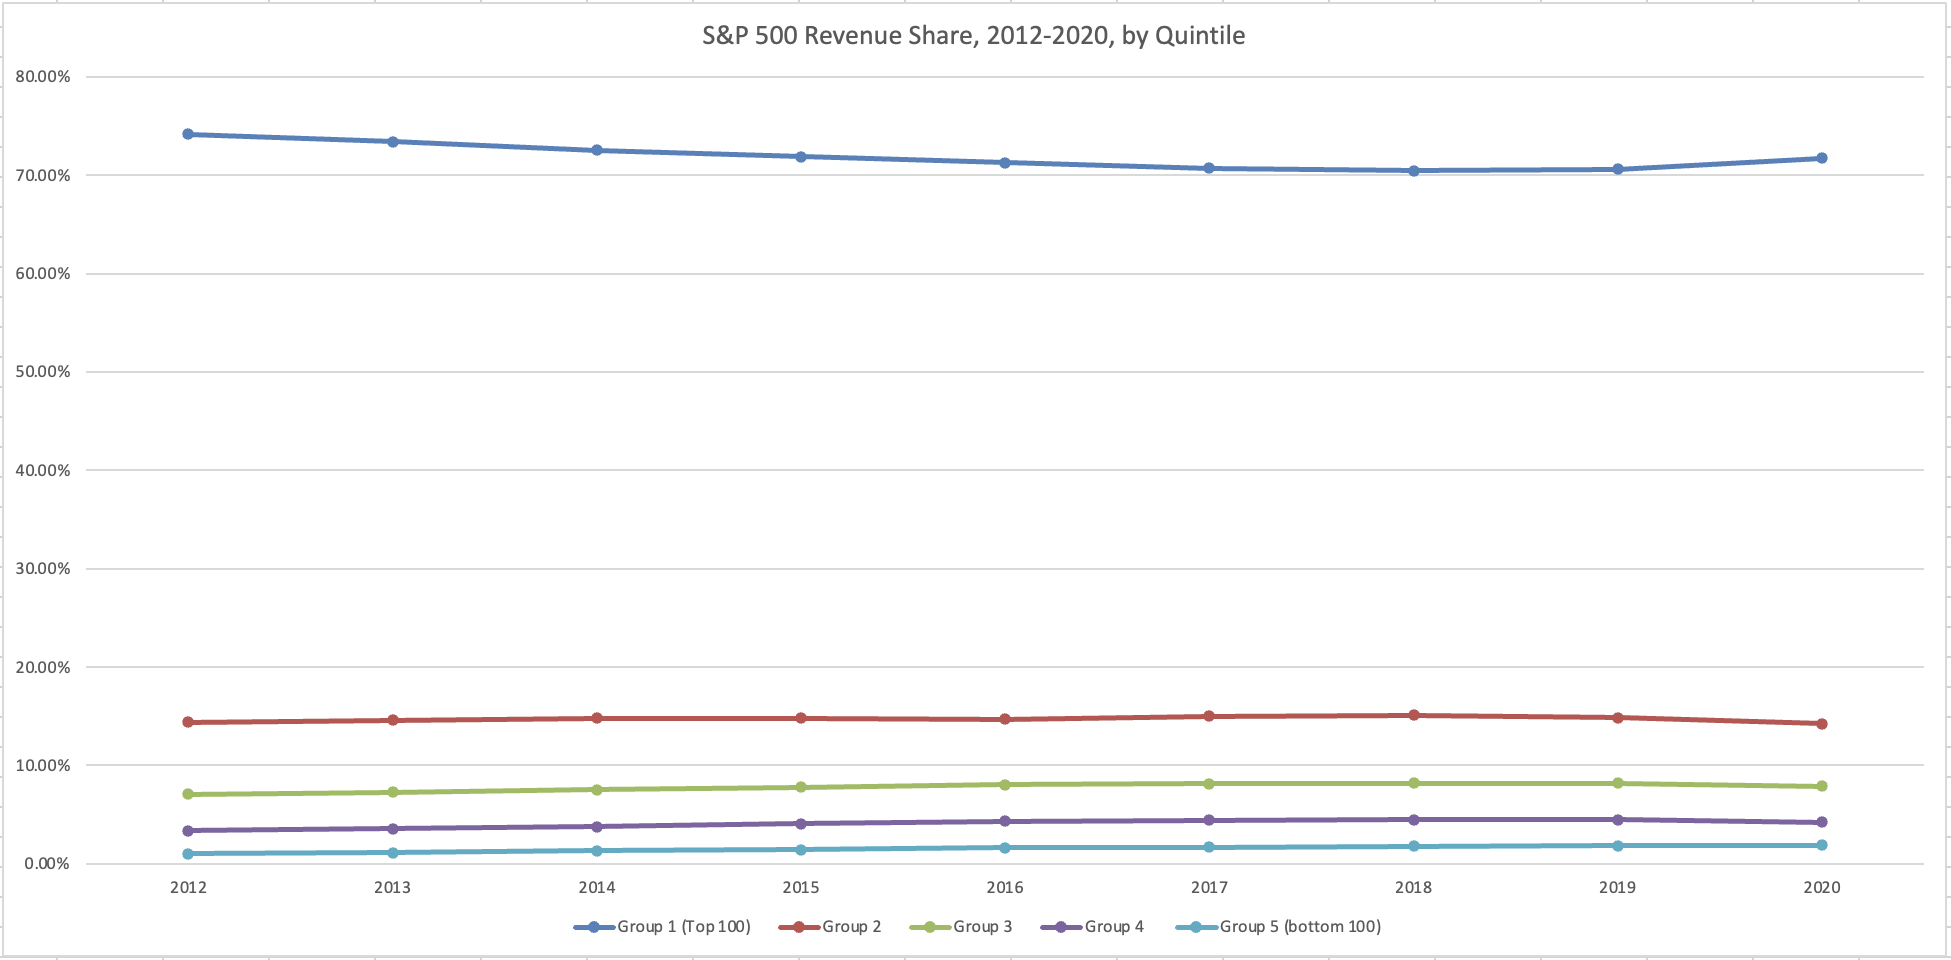
Figure 2, below, shows the share of revenue for each quintile, 2012 through 2020.

Again, the consistency is remarkable. Each quintile fluctuated within a relatively narrow range despite a host of changing circumstances, including interest rate hikes in the mid-2010s to the pandemic in 2020.
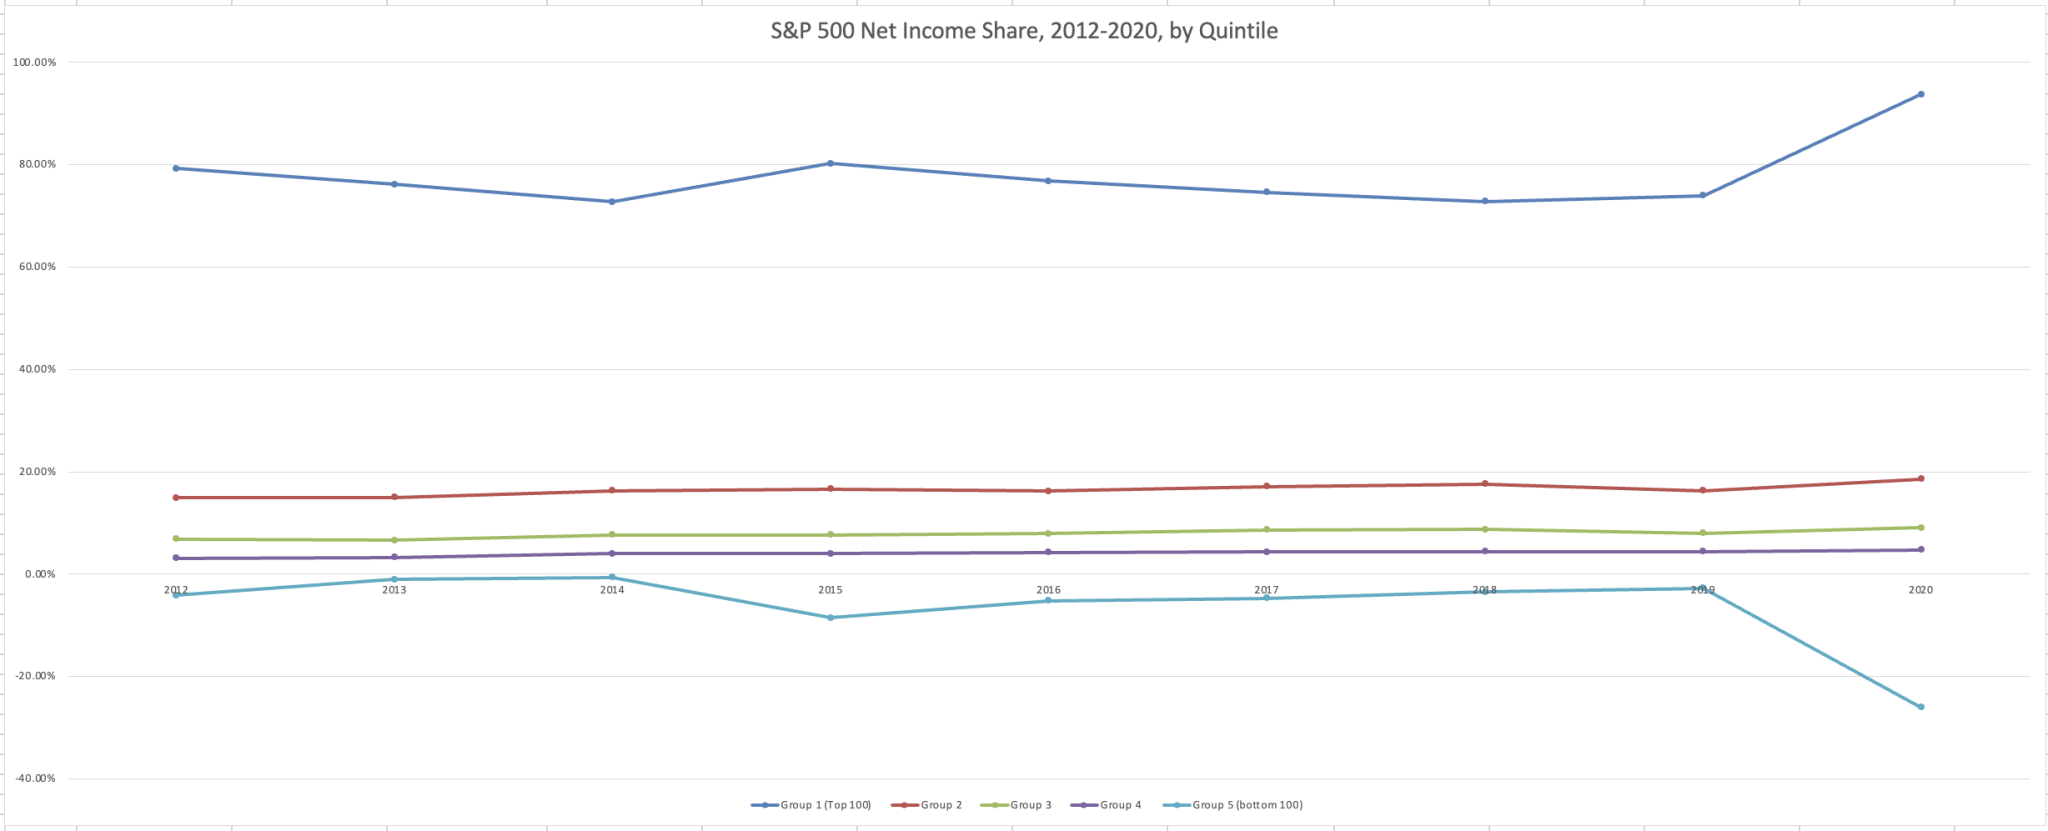
Then we looked at net income. See Figure 3, below. You may want to sit down for this one.

OK, obviously the largest firms saw their share of net income soar during the pandemic, while the share going to the smallest 100 S&P 500 firms plummeted. Even more jarring, however, is that when you look closely at the bottom quintile of the S&P 500, they have not turned a collective profit in the last nine years.
Yes, some firms in that quintile have turned a profit in some of the last years, but overall that quintile reported a net loss of $237.14 billion dollars. They never reported a positive net income number in any of the last nine years.
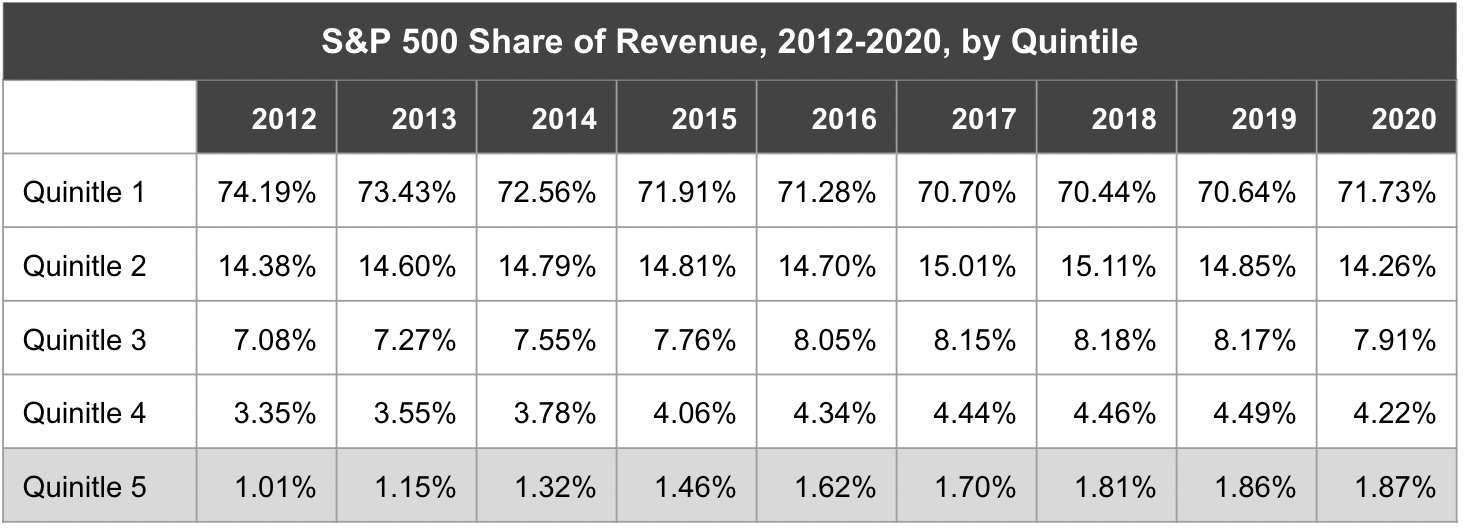
Why is that so? What ate away profits at those smaller large firms? We need to do further research on that question — but before we go, look at Table 1, below. It shows the exact share of revenue that each quintile took home for the 2012-2020 period.

The share of revenue for the fifth quintile has been going up year after year. Moreover, that quintile’s revenue has also more than doubled in absolute dollars, too: from $95.42 billion in 2012, to $225.14 billion in 2020 — and that 2020 number is only down marginally from $226.4 billion in 2019, before the pandemic.
So whatever is pressuring this fifth quintile is in the firms’ cost structure, not its revenue gains. Its revenue gains have been reliable.
What’s going on? We’re not yet sure — but Calcbench has the data, so we’ll keep digging.