Delta Air Lines filed an optimistic earnings release this week. Calcbench tools, however, show a clear picture of how much more recovery needs to happen.
Delta Air Lines’ latest earnings statement had an on-time arrival Wednesday morning, and overall the numbers looked impressive enough for a business battered by the Covid-19 pandemic — but dig a little deeper into the data, and you can see that Delta still has a long-haul flight to full recovery.
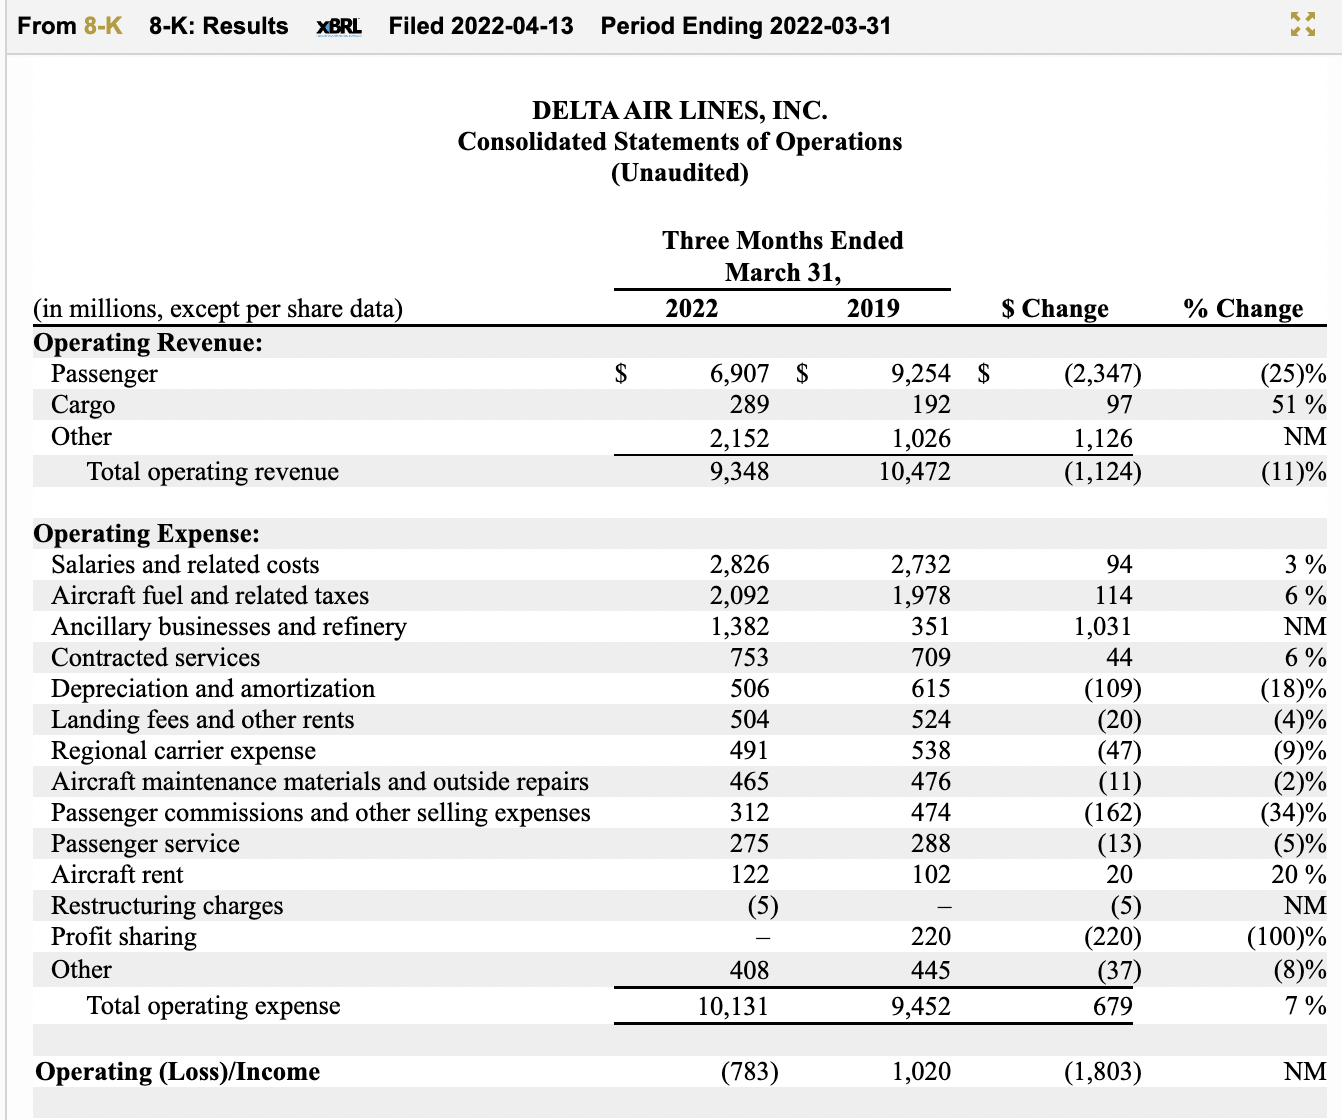
First, the headline numbers. Delta ($DAL) reported $9.35 billion in revenue and an operating loss of $783 million, compared to $4.15 billion in revenue and a $1.4 billion operating loss in the year-earlier period. Except, of course, the year-earlier period was a miserable one in the throes of a gigantic covid surge. So that’s not really comparable.
In its earnings release, Delta instead compared Q1 2022 to Q1 2019, the last time we had a first quarter that one could call normal. That’s fair, and in which case the comparables look like this:

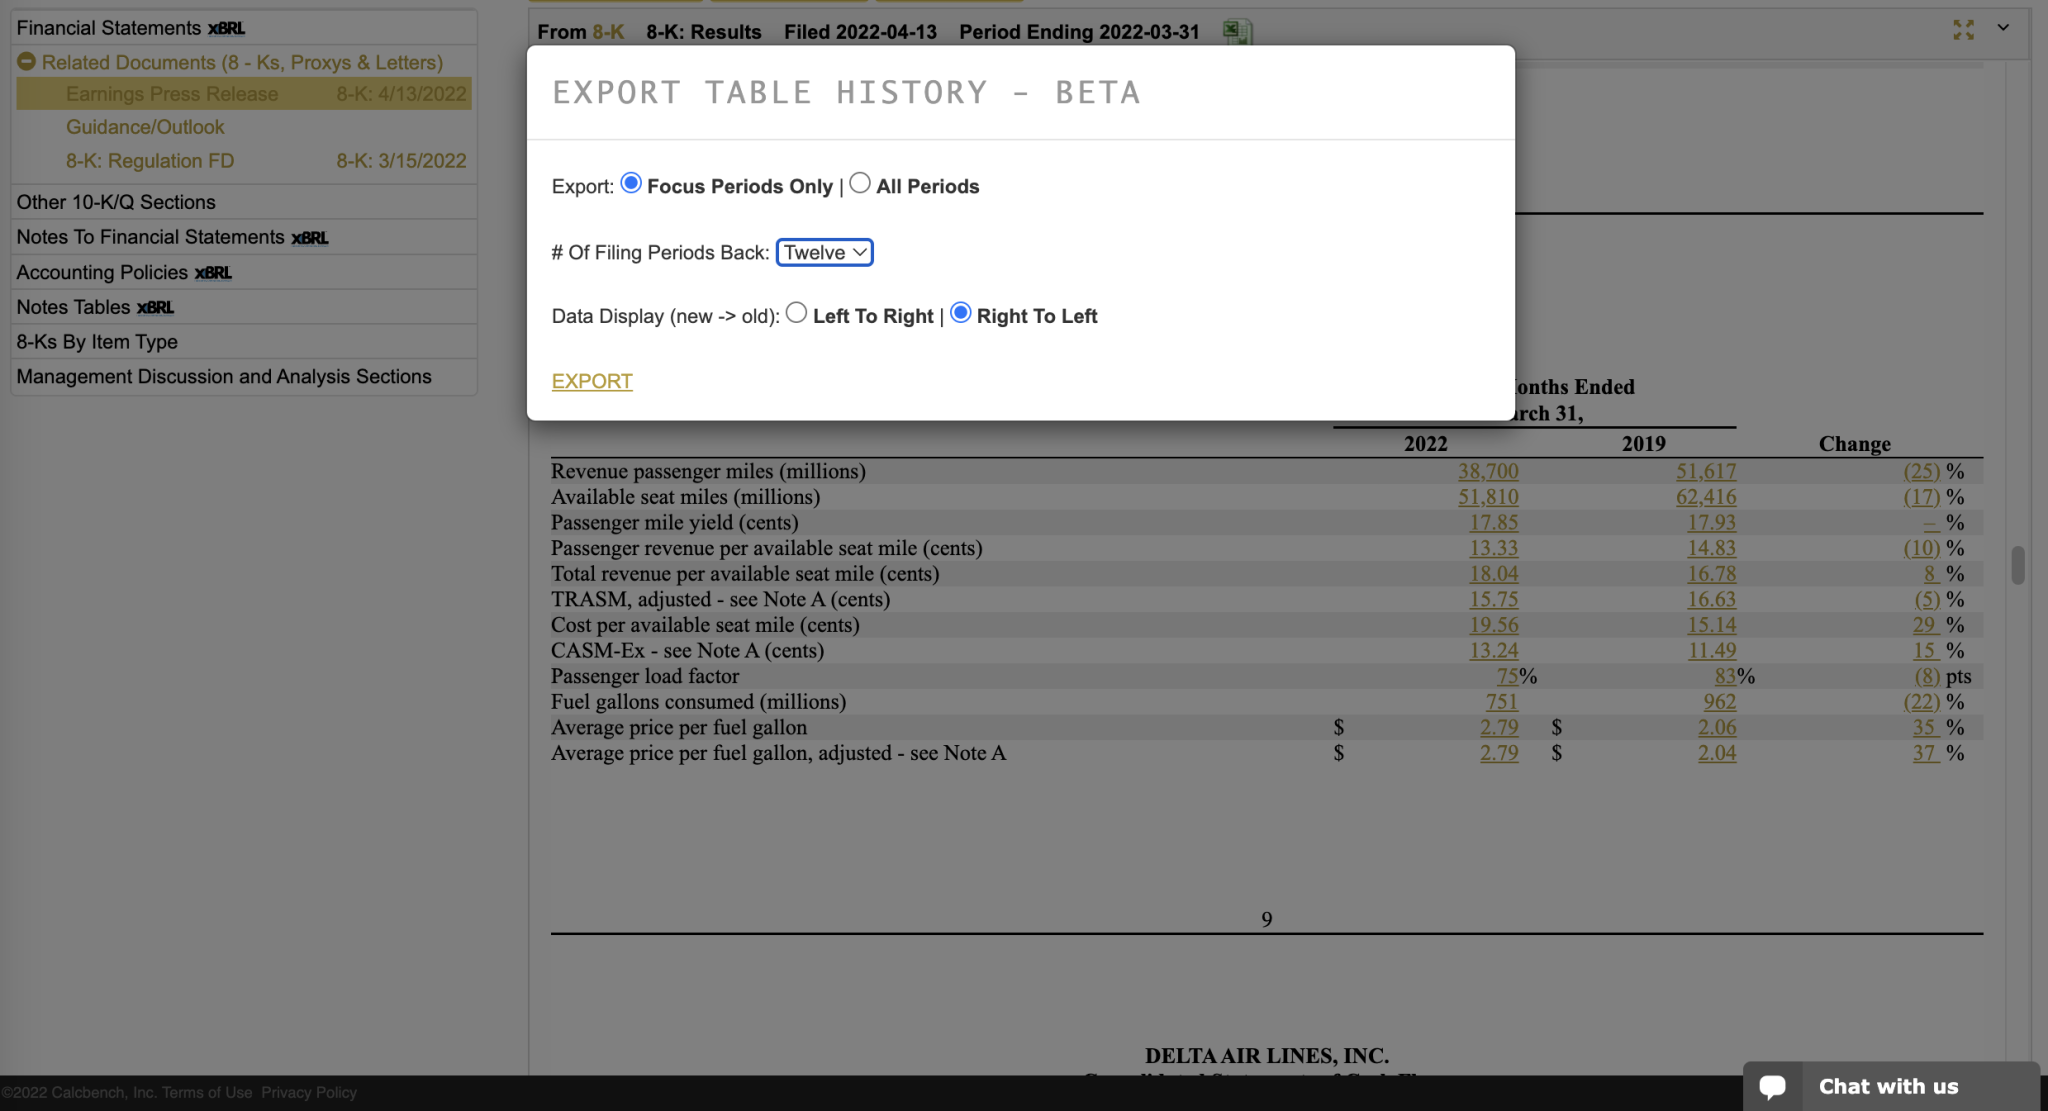
The research crew at Calcbench, however, was more interested in the non-GAAP performance metrics reported further down the earnings release. We found a telling one there on Page 9: passenger revenue per available seat mile.
“PRASM” is a popular efficiency metric in the airline world. It is measured in cents, and gives a sense of how much revenue — airfares, in-flight meals, change fees, baggage fees, and everything else — an airline can wring from a person with his or her rear end on a seat. Delta’s PRASM for Q1 2022 was 13.33 cents, compared to 14.83 cents in Q1 2019.
Calcbench, however, lets users dig deeper into that number with a few keystrokes. If you hold your cursor over that 13.33 number, an option appears allowing you to Export History. Click on that, and you see this interface.

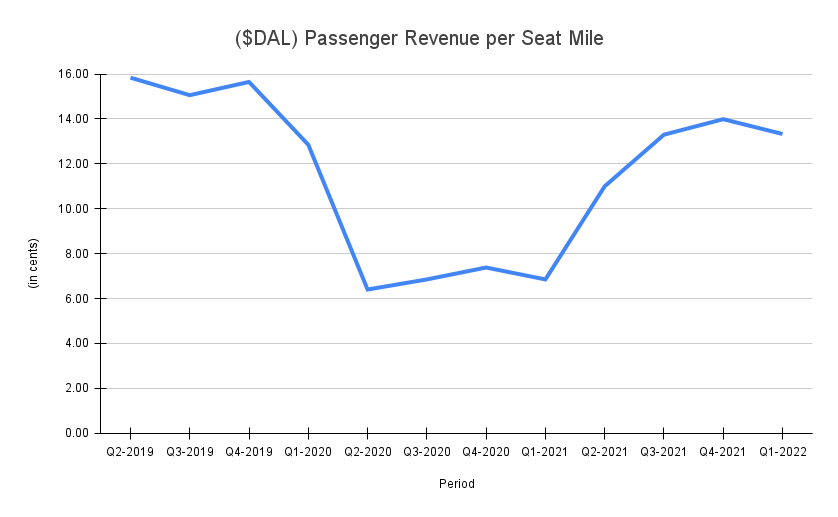
Our Export History feature lets you download prior-period disclosures for whatever number you’re staring at, including non-GAAP metrics. We decided to download the last 12 quarters’ worth of PRASM disclosures. Once that Excel sheet popped into view, we converted those numbers into a chart — and we saw this.

So as impressive as Delta’s recent pace of recovery might be, the airline still has a long way to go simply because it fell into such a steep nosedive in 2020 and 2021. Not until the end of 2021 did Delta come even within sight of pre-pandemic PRASM levels.
Calcbench subscribers can do their own analysis along similar lines, for Delta or any other company. (The research we did on Delta, from seeing the PRASM number to generating the Excel chart above, took us less than two minutes.) Just use our Interactive Disclosures page to find the filing you want to research, and then scroll through to the specific disclosure you want to research. Hold your cursor over that number, look for the Export History window to appear, and then do what we did above.
Happy flying!