Calcbench is, of course, the most incisive and well-written blog you can find about financial data — but we do still like to see what others out there are saying. So when we saw an item on ZeroHedge this weekend predicting that inflation in the retail sector is about to end, we were intrigued.
The gist of the post is that retailers cut their orders for goods sharply at the start of the pandemic, causing manufacturers and wholesalers to cut back on production. Then as consumer demand returned in 2021, retailers were caught flat-footed; that led to the inflation we see today. ZeroHedge calls all this “the bullwhip effect.”
Now, ZeroHedge argues, we’re about to see the crack of that whip, where retail prices start to plunge. Why? Because once retailers understood that they had too little inventory, they ordered dramatically more — which means they’re about to have a glut of goods on the shelves, and they’ll need to cut prices to sell it all.
ZeroHedge says that the important metric to watch here is retailers’ ratio of inventory to sales. As that ratio rises, retailers will have more goods they need to sell, which will pressure them to cut prices; then the inflation bubble bursts.
It’s an intriguing economic prediction. So Calcbench decided to look at the data and see what the numbers actually tell us.
We first looked at the overall direction of inventory-to-sales ratios for large retailers over the last several years, and found that this ratio has indeed been falling since 2019. See Figure 1, below (NOTE : all $ values in millions).

So the macro-level trend is clearly downward, which squares with ZeroHedge’s theory, which squares with what everyone is seeing when they look at a price tag.
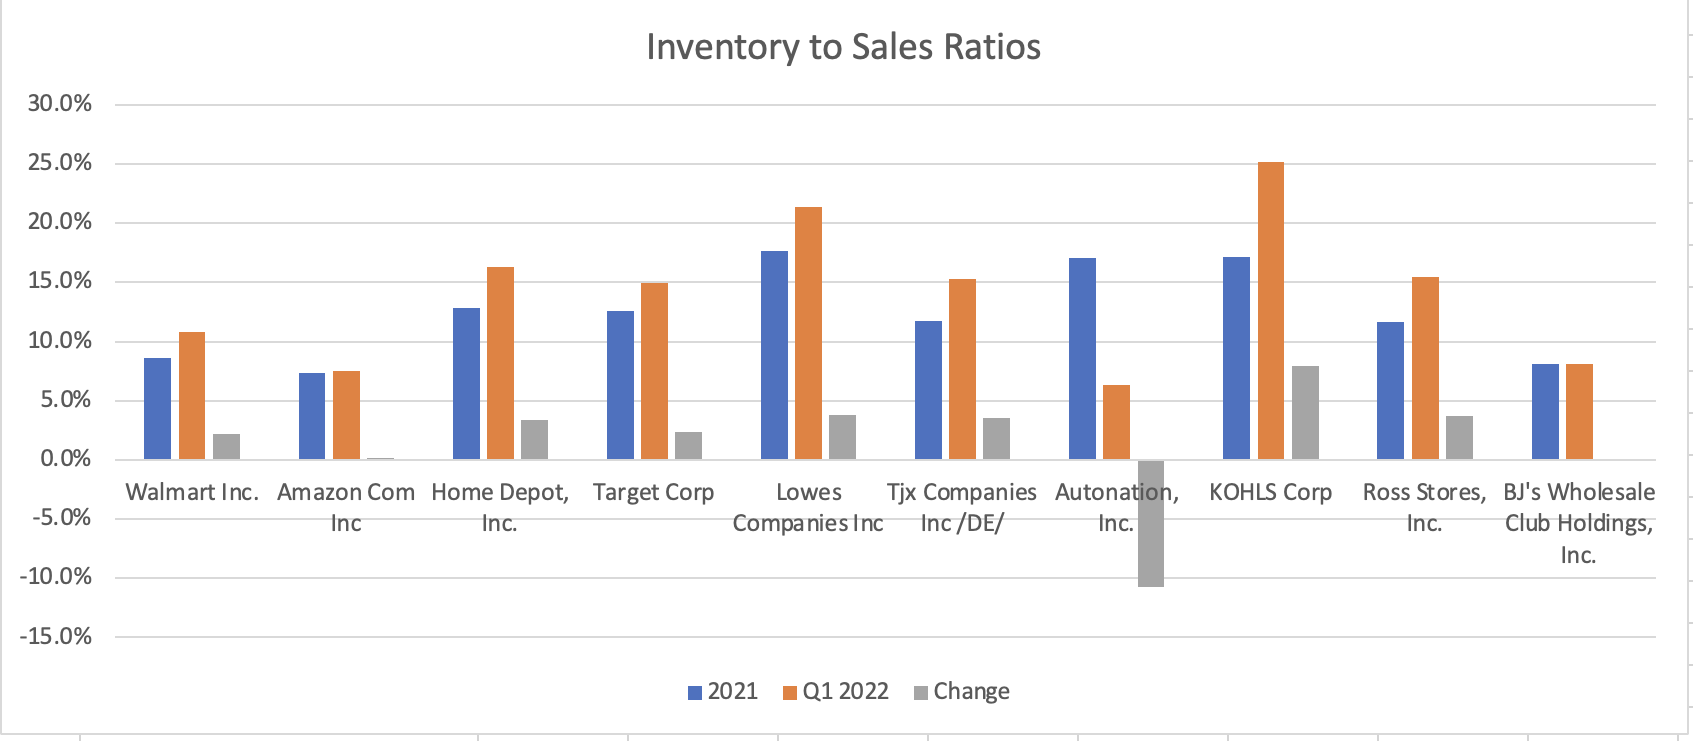
Calcbench also looked at 10 specific retailers and compared their income-to-sales ratios for Q1 2022 against their ratios for all of 2021. Of those 10 firms, seven had significantly higher ratios in early 2022 than they did in 2021. Only one had a lower ratio, and two were essentially flat. See Figure 2, below.

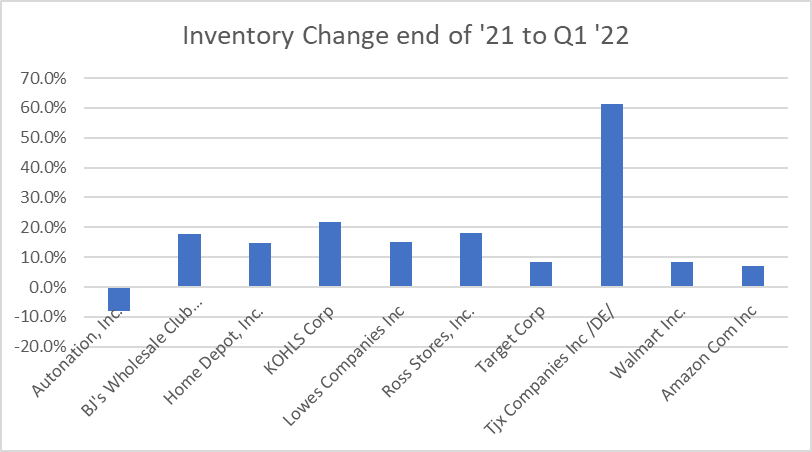
If you prefer a simpler view of the data, one could just look at change in Inventory levels at these firms from the end of ‘21 to the end of the first quarter of ‘22. The story is of rising inventories.

Yes, the rise in percentages for Wal-Mart and Amazon is small, at roughly 8% each but in dollar terms that is a $4.7 billion dollar increase in inventories at Wal-Mart and a $2.3 billion dollar inventory increase at Amazon. Home Depot is up 14.6% for an increase of over $3.2 billion.
If you believe ZeroHedge’s theory, then we’re about to see these retailers start offering clearance sales and other discounts to move all those extra goods off their hands.
Whether one actually should believe ZeroHedge’s theory is not a question for Calcbench to answer. Analysts should note, however, that if retailers start slashing prices, that presumably would lead to poor revenue growth later this year — and expectations of lower future growth push stock prices lower. Well, that’s what we’ve seen for shares of large retailers lately. So perhaps people do expect this inflationary bullwhip to crack after all.
Choose Your Own Analysis
Analysts can conduct their own research along these lines with just a few keystrokes in Calcbench. First select the retailers you want to study; then visit our Bulk Data Query page.
From there, you can select the date range you want to search. We would recommend you set your search for quarterly results, using a period range from, say, the start of 2019 through first-quarter 2022. Then check off the Revenue box on the income statement column, and Inventory from the Asset column. Figure 3, below, shows a typical setup.

You’ll then get an Excel spreadsheet with all the data you want, and you can perform whatever analysis and modeling you need.
So go get cracking!