Third-quarter earnings releases will start arriving this week, with several of Wall Street’s largest banks leading the way. Citigroup, JPMorgan Chase, Wells Fargo, Morgan Stanley and several others are all expected to announce Q3 results on Friday.
Those reports will be full of useful data. So ahead of the big day, Calcbench wanted to demonstrate the types of analysis you can perform quickly and easily on that data using our research tools.
We decided to look at banks’ Tier 1 capital over time. Tier 1 capital is the capital that banks must hold in reserve so that they can withstand large losses during difficult economic times. It consists of common stock plus other disclosed reserves, such as those for bad losses. Under the Basel III accords, drafted to avoid a repeat of the 2008 financial crisis, a bank’s Tier 1 capital must be at least 6 percent of its total risk-weighted assets.
More simply, Tier 1 capital is an important metric of a bank’s financial strength. So Calcbench tracks it.
We examined the Tier 1 capital ratio (that is, Tier 1 capital compared to total assets) for 100 banks, studying how the average ratio compared to the median ratio over time — and yes, we found a pattern.
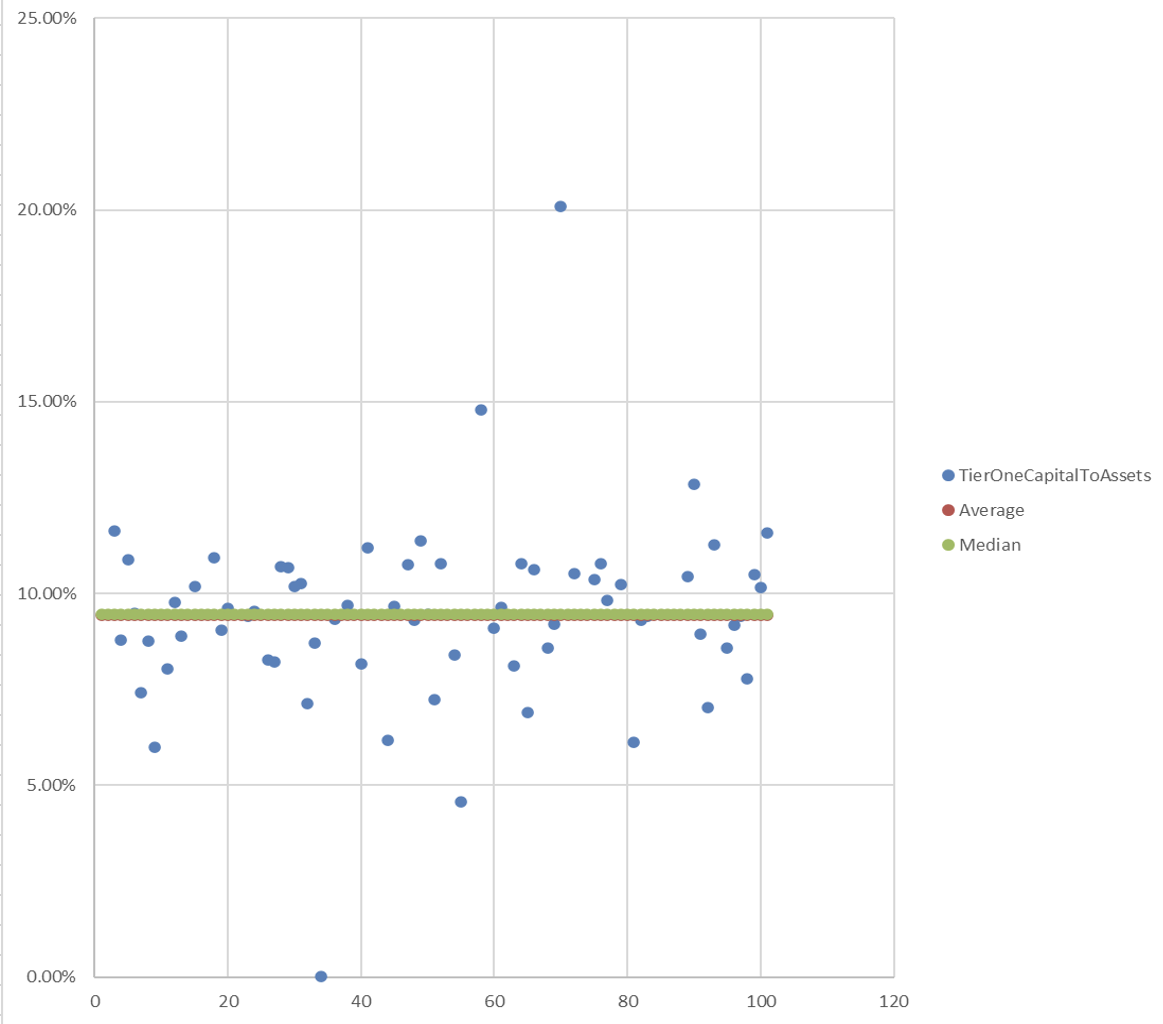
Figure 1, below, shows the Tier 1 ratios in 2014, all of them dot-plotted onto a chart. The average ratio is in red, the median ratio in green. As you can see the average and mean ratios are nearly identical. (Indeed, you can barely see the red line, tucked underneath the green.) Average ratio that year was 9.43 percent, versus a median average of 9.46 percent.

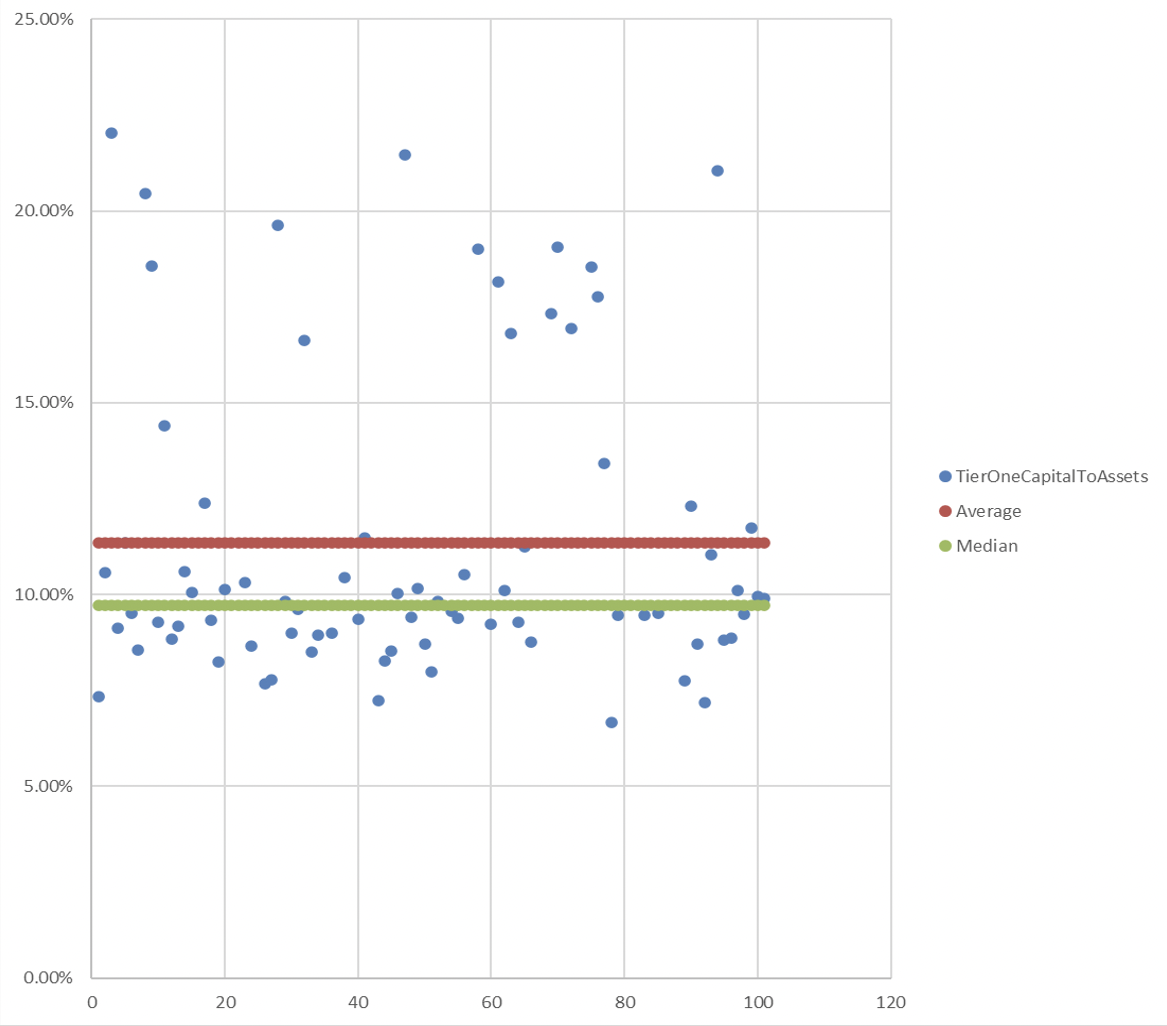
Now here’s the same chart using Tier 1 ratios from 2018.

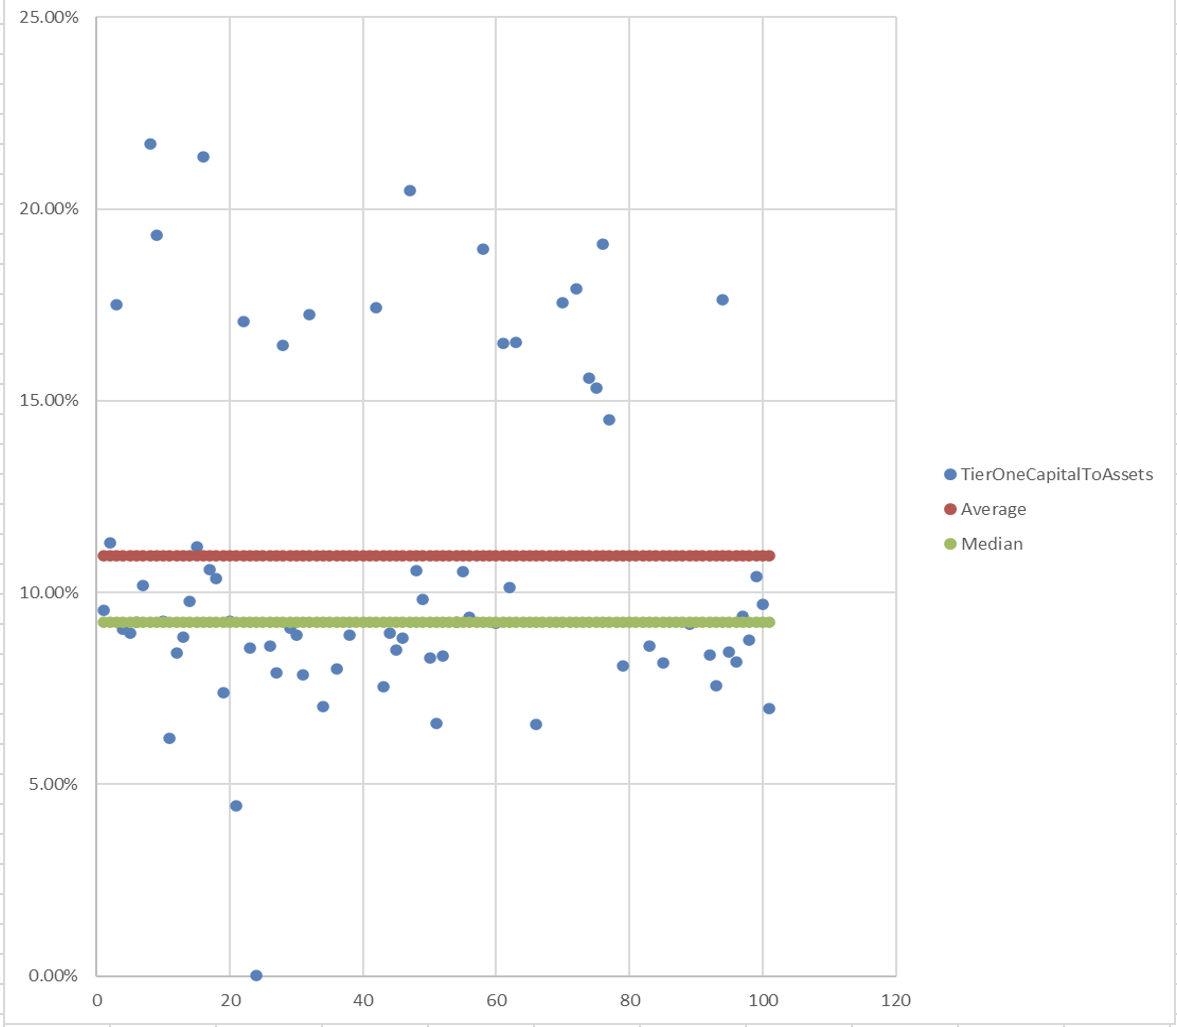
And one more time, using data from 2021.

As you can see, the spread between the average ratio and the mean ratio has widened over time. That happens because several banks have been posting higher Tier 1 ratios in recent years, which has the statistical effect of pulling the average ratio higher, even while the median remains relatively steady.
Banks can post higher Tier 1 ratios for several reasons, but most usually it happens because a banking regulator tells them to reserve more capital. (Say, when a bank fares poorly on its annual stress test, something required annually for large banks under the Dodd-Frank Act.)
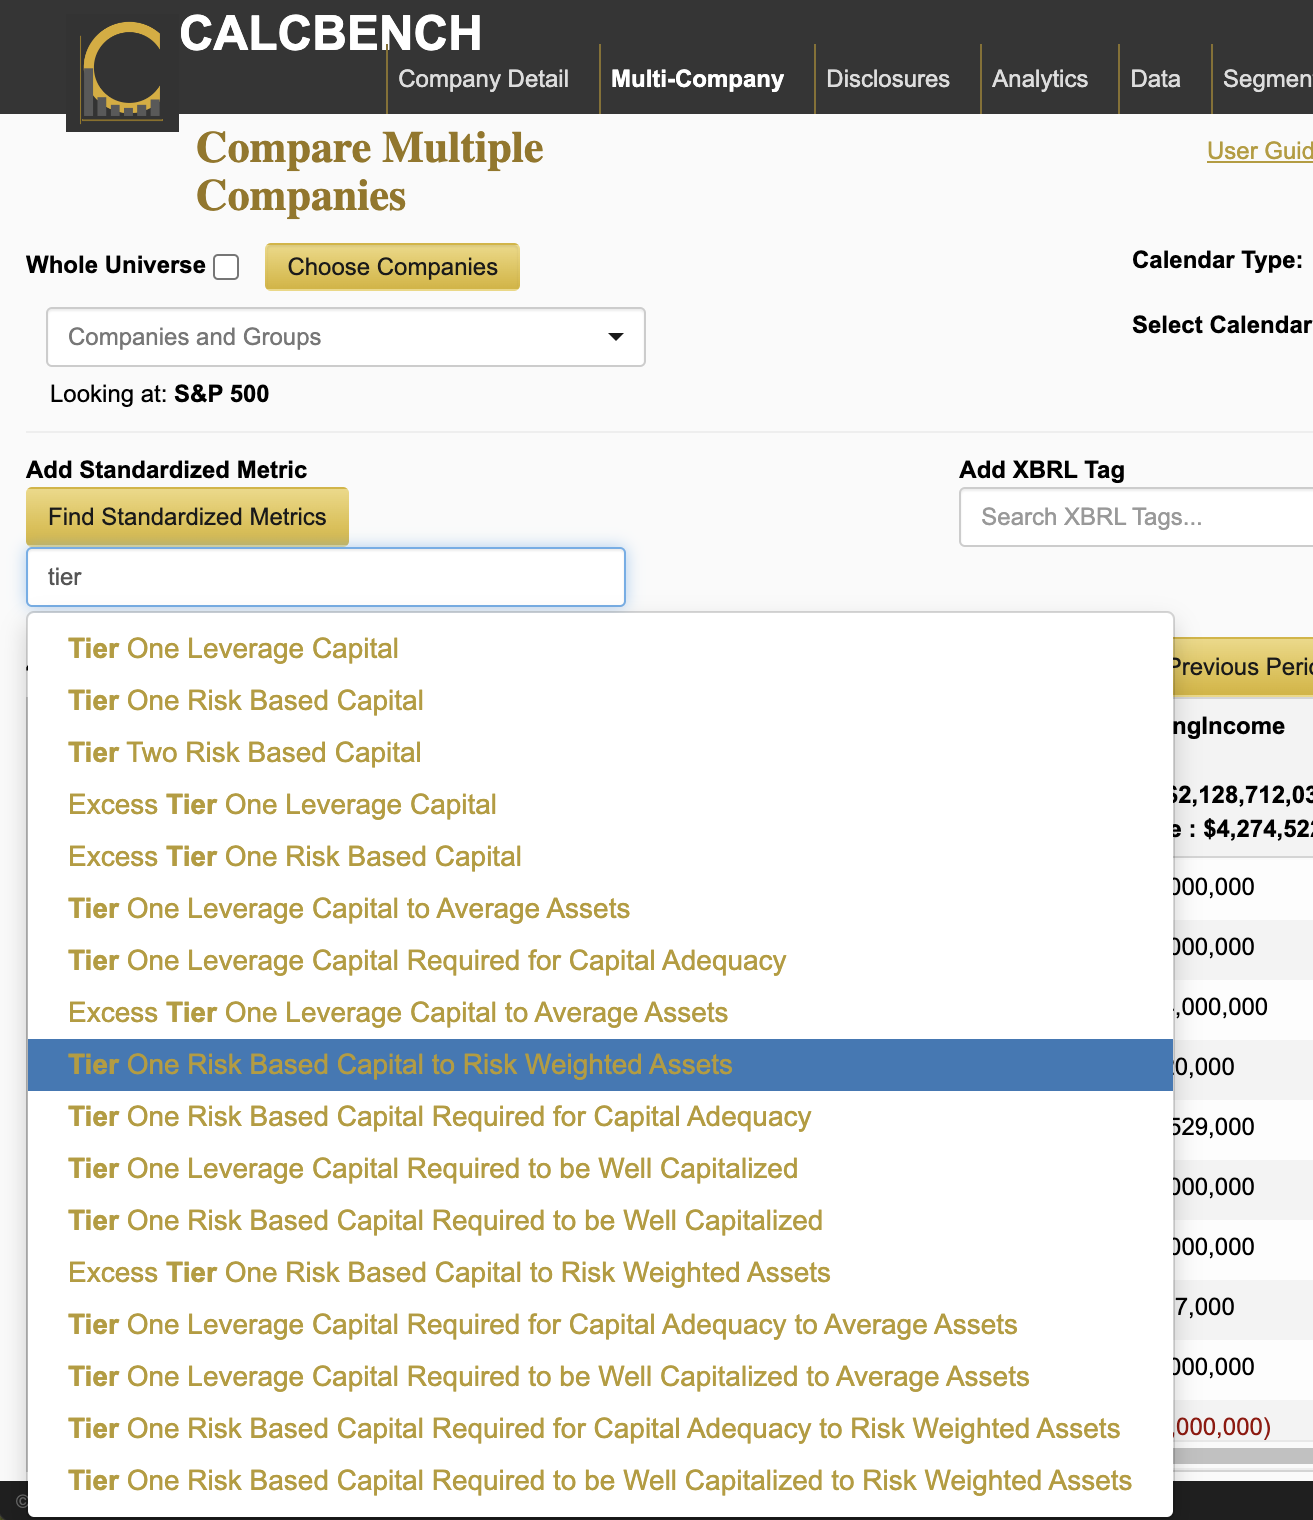
You can do your own research on Tier 1 capital using our Multi-Company page. We track numerous disclosures related to Tier 1 capital; just start typing “Tier 1” in the text field for Standardized Metrics on the left side of your screen, and a bundle of choices will appear. (See Figure 4, below.)

Now all we need is that Q3 data to bring our analysis up to date. Stay tuned; once the banks start releasing those earnings statements, we’ll have the data ready for your fingertips a few minutes later!