Earlier today, Bloomberg published an article citing UBS research, that effectively stated that earnings quality as measured by the comparison of cashflow from operations versus net income is growing and, thus, deteriorating. This work is near and dear to our hearts at Calcbench as some of us cut our teeth by following the work of Richard Sloan on this topic!
So, we set out to show people just how efficiently you can build models like this using Calcbench. It also illustrates the importance of having a strategy to obtain fundamental financial data.
Without further ado, here is a link to a spreadsheet that does an exercise similar to that in the Bloomberg article. In short, we collected Net Income, Cashflow from Operations and Depreciation & Amortization from our database using our Excel Add-In. Next, we subtracted Depreciation from Net Income and then compared that to Cashflow from Operations.
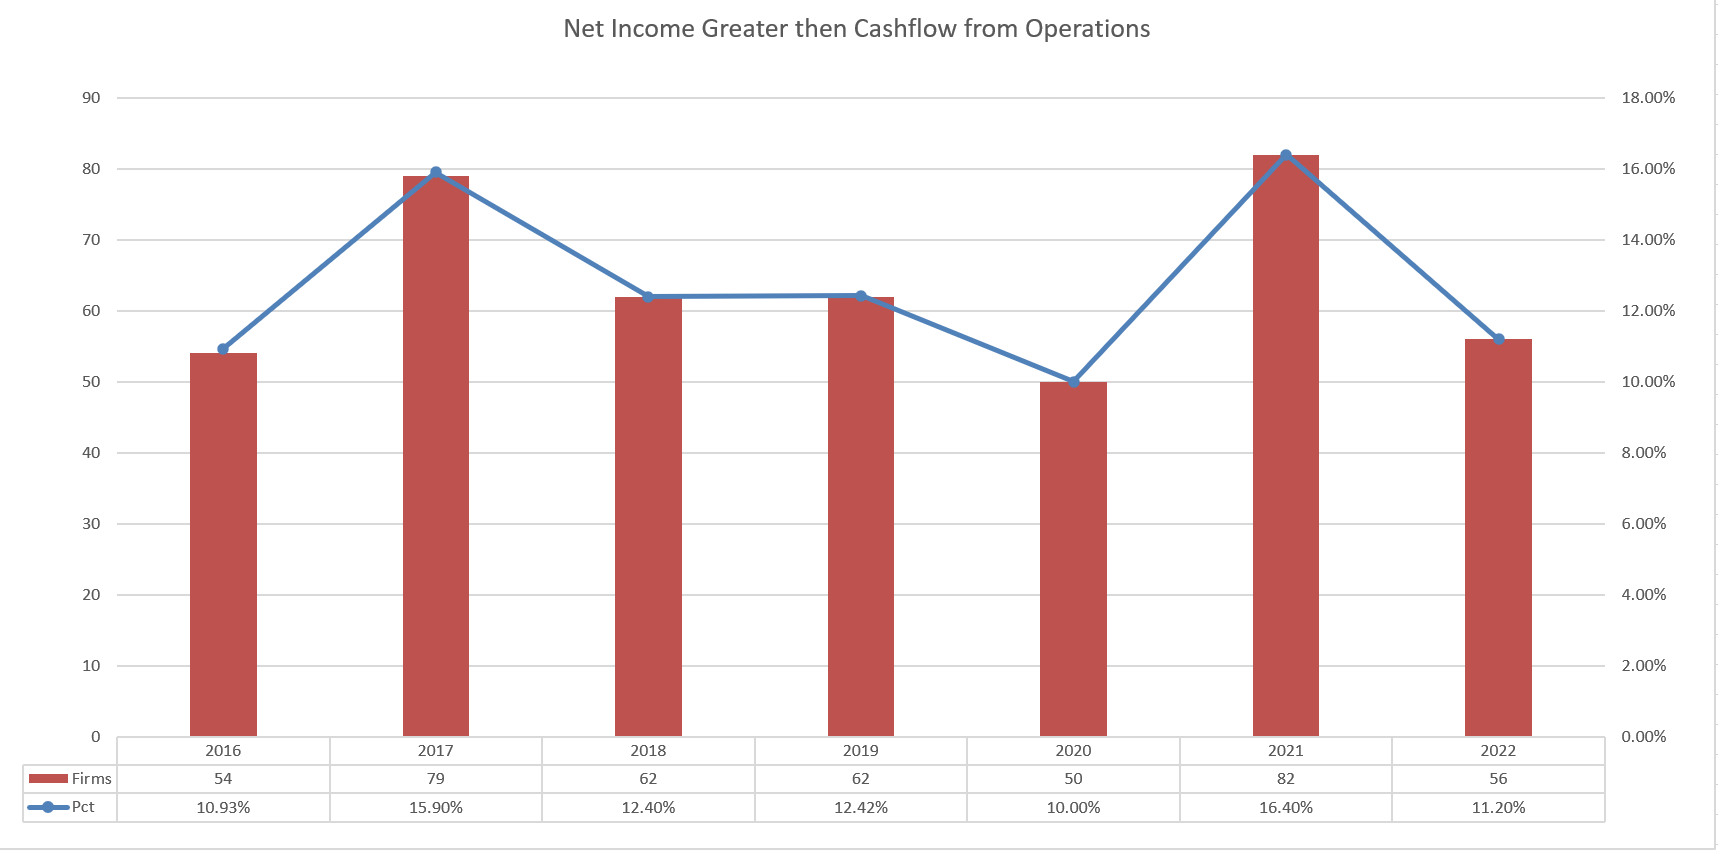
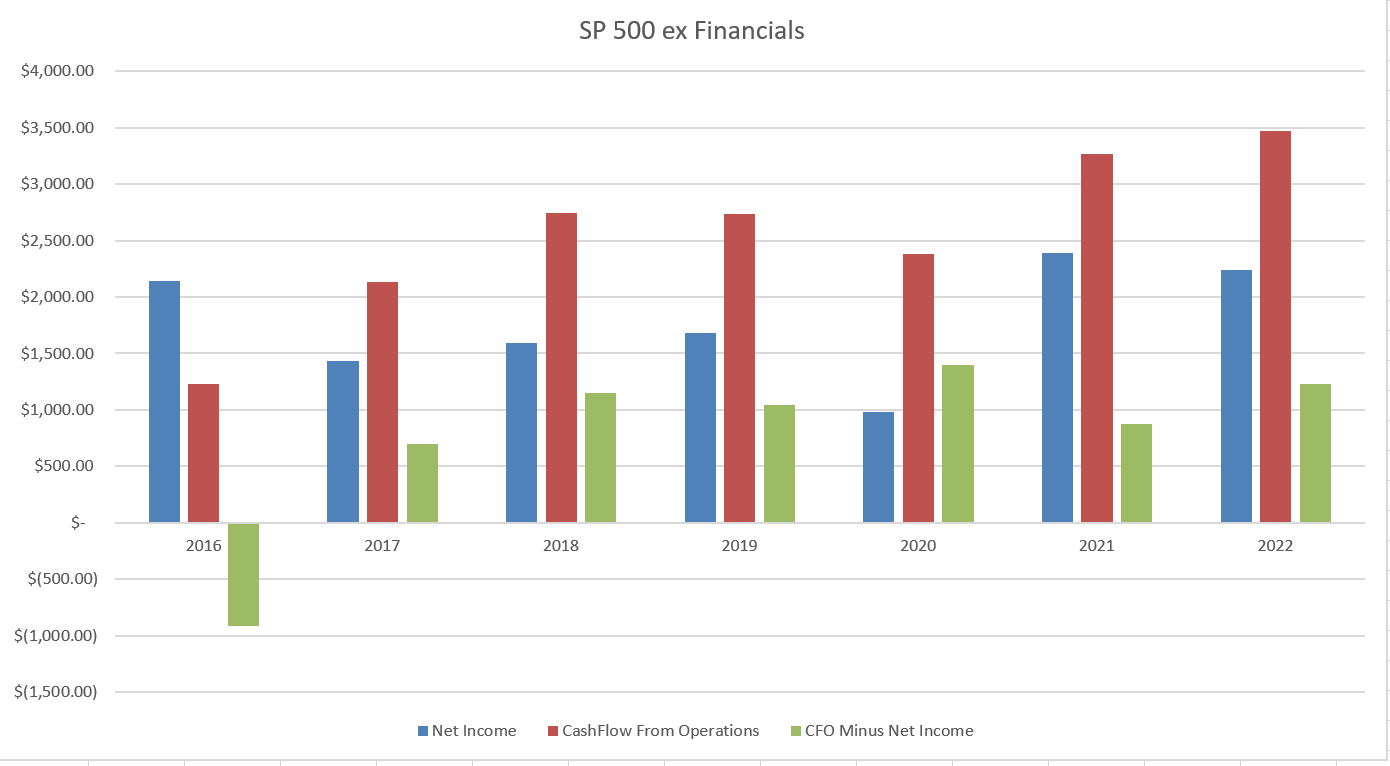
We summarized our work in two charts. In both cases, the universe is the S&P500 ex financials.
It confirms the UBS work (phew). In the chart below, for 2022, the 11.2% of our firms, had Net Income greater than Cashflow from Operations. In the lower chart, notice that the green bars ( CFO minus Net Income) are above zero for every year since 2016. Our study included more firms because we used data that became available through yesterday (February 28, 2023).
The link to our spreadsheet is here. Please note that the spreadsheet comes with embedded Calcbench formulae and will not work without a subscription. For a Calcbench trial subscription, please visit https://www.calcbench.com/join

