As we all prepare for Q2 2023 filings, which will start to arrive in mid-July, let’s pause to remember there’s more to financial analysis than tracking revenue, net income, assets, and other standard-fare financial disclosures.
There are a host of other, industry-specific performance metrics, too; and Calcbench can help you track them as well. Let’s start with an example from the retail sector.
You might recall that last year we had a post on the inventory-to-sales ratio, a number that gives analysts a sense of the pressure a retailer might face to cut prices. Essentially, as that ratio rises, retailers have more goods they need to sell. That pressures them to cut prices, so they can move the inventory off store shelves and make room for new goods.
So we wondered: What is a “normal” inventory-to-sales ratio for various retailers? And how has that ratio changed for various retailers over the last 18 months or so.
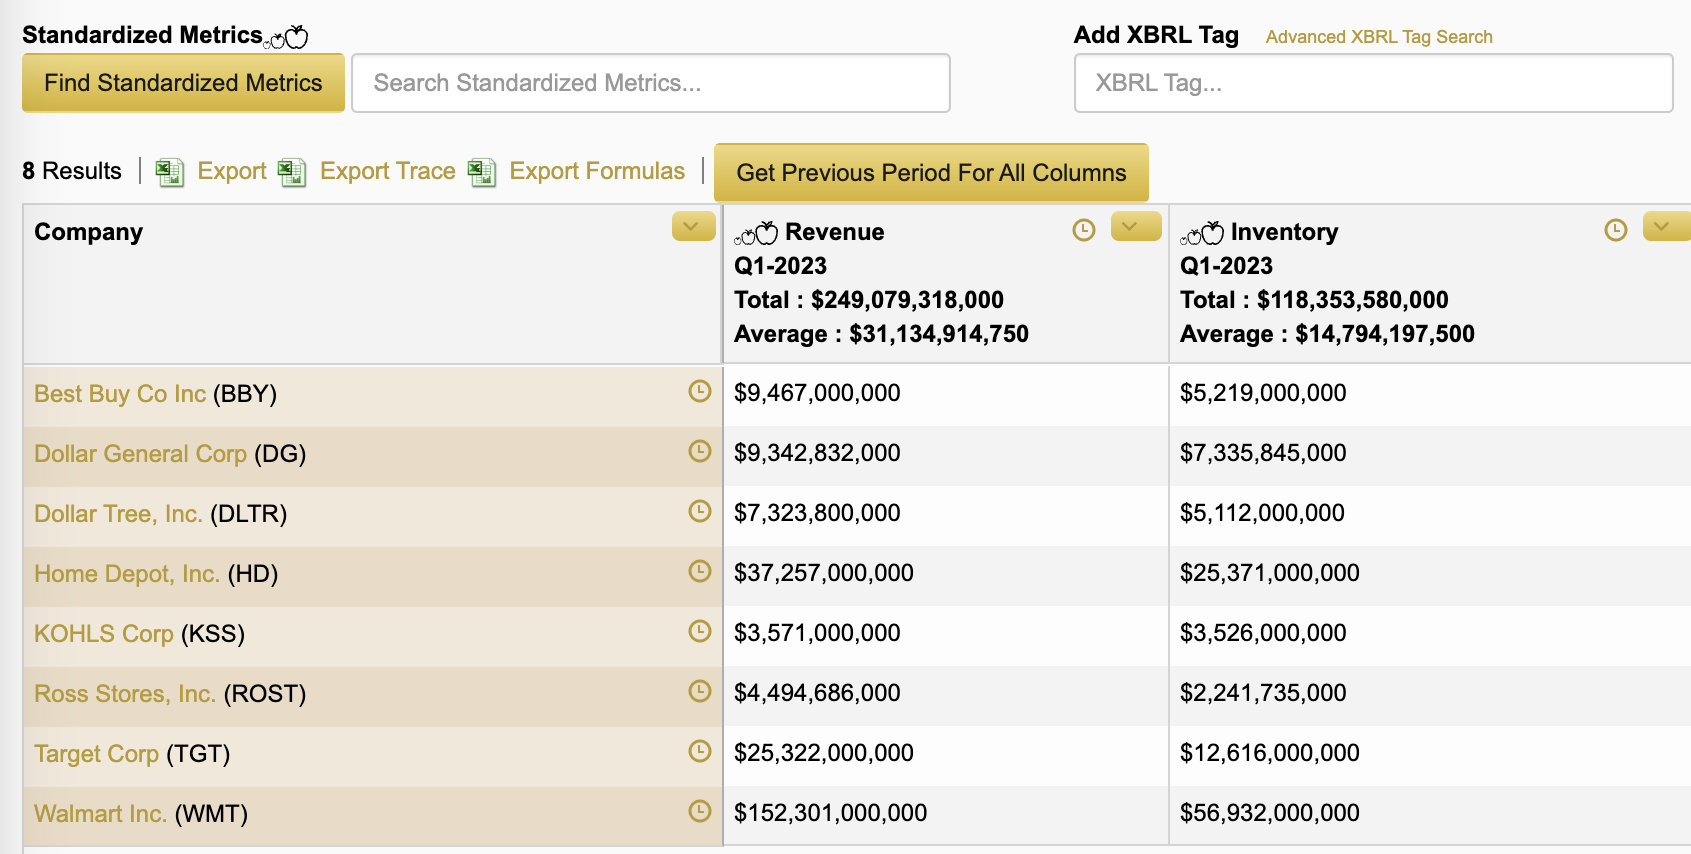
We were able to compile that information easily enough using our Multi-Company Search page. Just define the list of retailers you want to track, and then track sales and inventory for those firms using our standardized search field. The result will look something like Figure 1, below.

From there, you can export the data into a spreadsheet and perform some basic math to calculate the inventory-to-sales ratio. For example, in our sample of eight firms above, Walmart ($WMT) has the best ratio by far — 37.4 percent for Q1 2023, while all others were anywhere from 50 to 78 percent.
Suppose, however, that you also want to see how those ratios trend over time. That’s a straightforward exercise in Calcbench too.
Go back to Figure 1, above. See that small yellow square in the corner of the Revenue and Inventory columns? Click on that, and you get a pull-down menu that includes a “See previous period” option. You can use that to pull up several periods of the disclosure in question. We did so, pulling up revenue and inventory numbers for all eight firms, for the last five quarters. Then we charted the inventory-to-sales ratios over time.
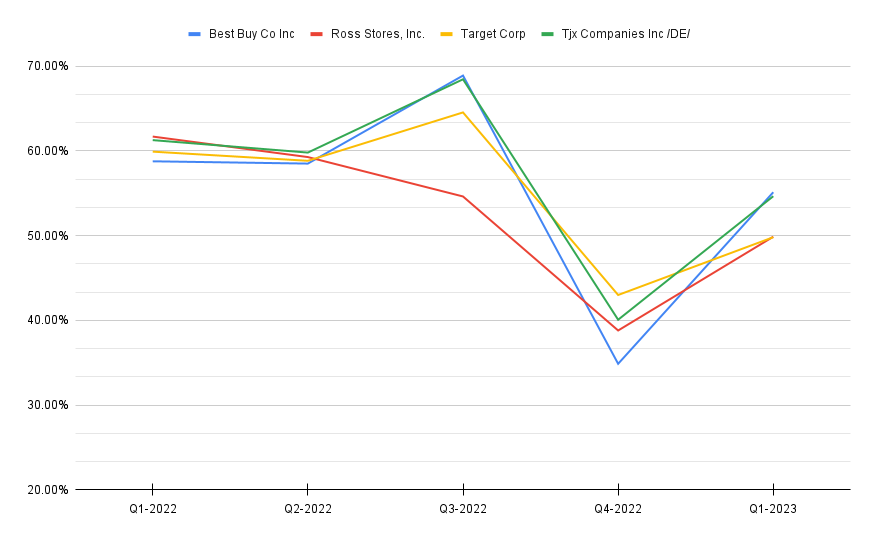
Figure 2, below, shows some of our results. As you can see, those ratios generally spiked last summer (when inflation was high and people were closing their wallets), before plunging in Q4 (when retailers were desperate to make annual sales quotas, so they slashed prices to get those wallets back open.

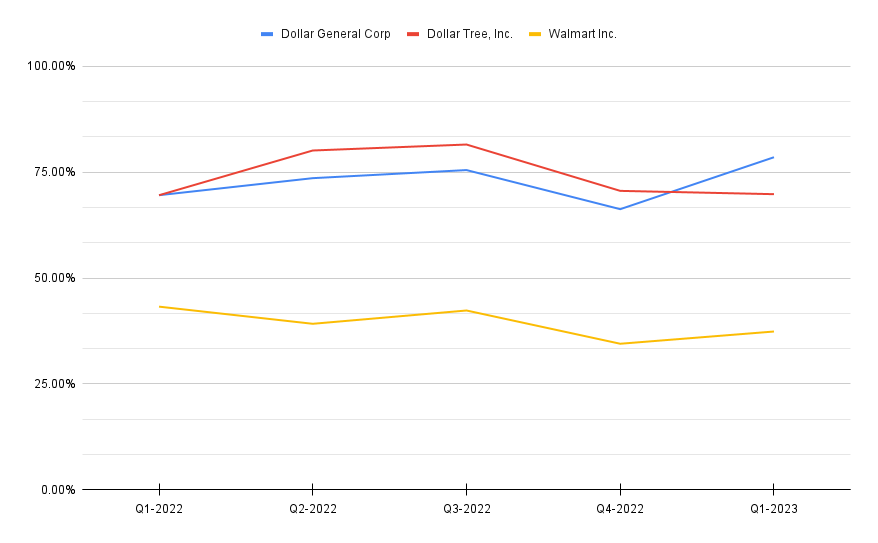
Then again, not all retailers follow this pattern. Figure 3, below, shows inventory-to-sale ratio over time specifically for Walmart, Dollar General ($DG), and Dollar Tree ($DLTR).

As one can see, Walmart consistently has a rock-bottom ratio relative to the other retailers in our sample. We were also intrigued to see that while Dollar Tree and Dollar General do have the highest ratios in our group, their ratios do track each other fairly closely. Presumably that’s because they are direct competitors, selling the same low-cost stuff all year long.
Our point with this exercise isn’t to draw any conclusions about these specific retailers; they’re a motley bunch with different operations and different audiences. We simply want to point out that one can derive a wide range of insights by pulling some basic disclosures and doing a bit of math on those numbers.
Of course, Calcbench also tracks a bundle of other performance metrics relevant to the retail sector, including:
- Percent change in comparable store sales
- Number of stores
- Sales by channel (in-store versus online)
- Comparable sales by channel
- Average “ticket” (that is, average amount paid at checkout)
- Sales per retail square foot
- Number of customer visits
Not all retailers report all those metrics, but most retailers report at least some of the above or other metrics. Your best bet is to scan the earnings release closely, see which metrics the company discloses, and then track that over time by holding your cursor over the number and using the “See tag history” feature that pops up.
We’ll take a look at other industry-specific disclosures over the next few weeks, ahead of Q2 earnings reports. Stay tuned!