Second-quarter earnings reports continue to arrive, and now we’re starting to see some of the large consumer products manufacturers file their statements. That gives us the opportunity to ask an important question.
Total revenue for these companies is generally up, which is nice — but what about the volume of sales?
Volume refers to the actual number of items a consumer manufacturer ships, rather than the price of those items. It can be an important indicator of the company’s overall health.
For example, if a consumer goods company reports that revenue is up 2 percent because the company raised prices, volume declined by 3 percent at the same time because consumers are buying fewer of those more expensive items, that’s worrisome. It could mean that consumers have less income to spend at the store, and higher prices will only carry that company so far. At some point it must start moving more units of whatever it makes.
The above scenario is no hypothetical, by the way; it’s exactly what Procter & Gamble ($PG) reported in its earnings statement filed on July 28.
Specifically, P&G reported net sales of $82 billion for the fiscal year that ended June 30, an increase of 2 percent from the prior year. Organic sales grew 7 percent, which also sounds like good news. Except, that increase in organic sales revenue came from higher prices and a “favorable mix” of goods sold, partially offset by a 3 percent decrease in shipment volumes.
Translation: Procter & Gamble had higher sales because it raised prices on Pampers, Tide, Head & Shoulders, and all the other stuff the company makes, and consumers responded by buying fewer of those more expensive things.
Figure 1, below, tells the tale, neatly sorted by P&G’s major product categories. That 2 percent increase in net sales is on the far right, while the 3 percent decline in volume is on the far left.

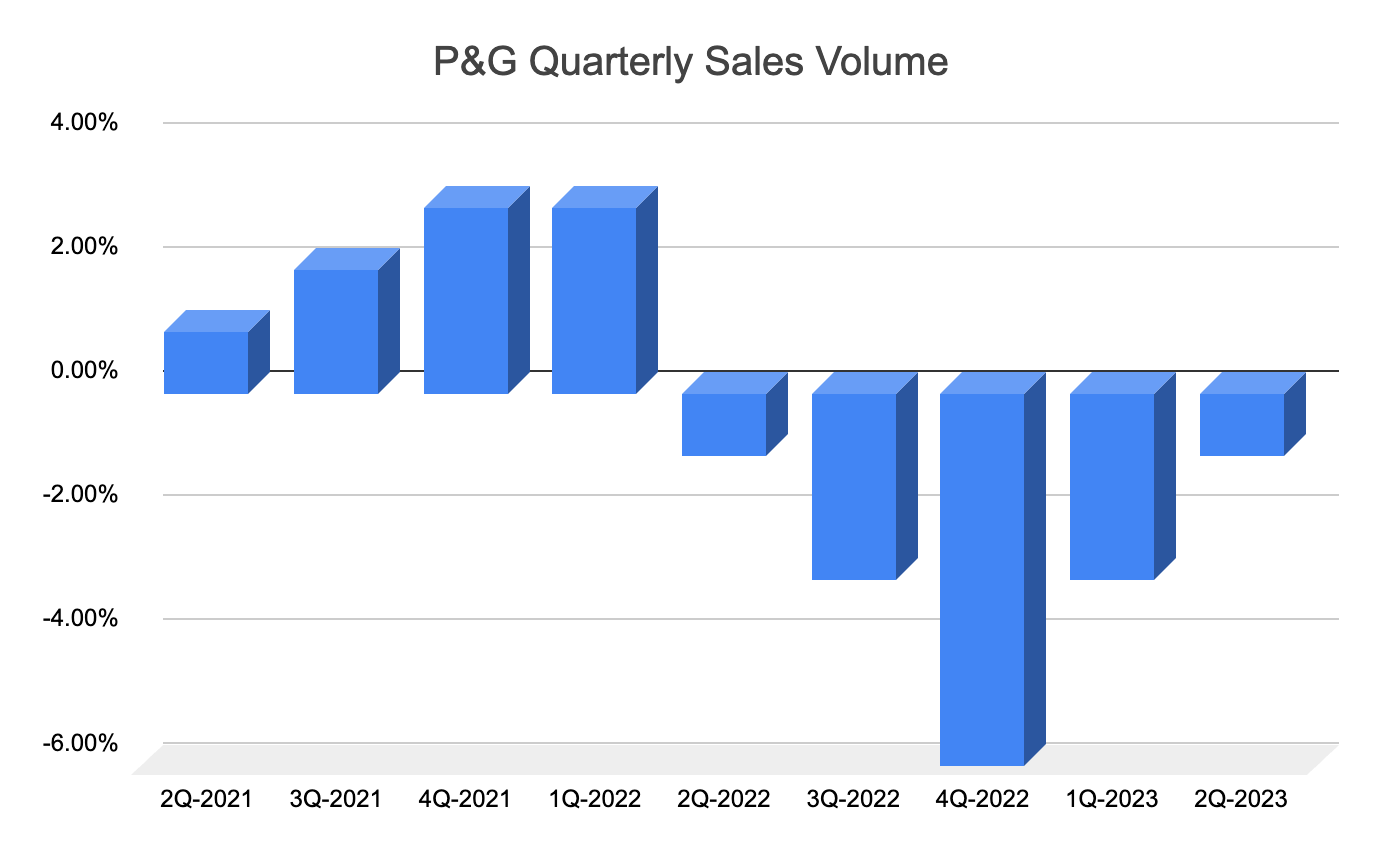
Next question for financial analysts: How do those volume figures track over time? Calcbench can help you there, too, with our Show Tag History feature. We used it to track P&G’s sales volume disclosures for the last several quarters.

Yikes, that trend is not good. Clearly it follows the rise in inflation in 2022, apparently lagging about one quarter behind the worst inflation numbers (which were in mid-2022). P&G has seen smaller volume declines since then; the question now is whether sales volume will actually turn positive in latter 2023 as inflation appears to be fading.
For the record, P&G executives know all this and see the urgency here. One recent Wall Street Journal article spotlighted P&G, Colgate-Palmolive ($CL), Kimberly-Clark ($KMB), and a few other consumer products manufacturers. Executives at those companies have stressed on earnings calls that higher sales volumes are a top priority for the rest of the year.
Sale volume is a widespread disclosure these days, typically reported in the earnings release and the Management Discussion & Analysis section of the 10-Q. Look for it there, and use our Show Tag History feature to track volume disclosures over time.