We love to follow interest expense here at Calcbench, always looking for new ways to understand how higher interest rates are eating into corporate profits and other financial goals. We last looked at interest expense in May, and the picture was not terribly pretty; today we offer another view.
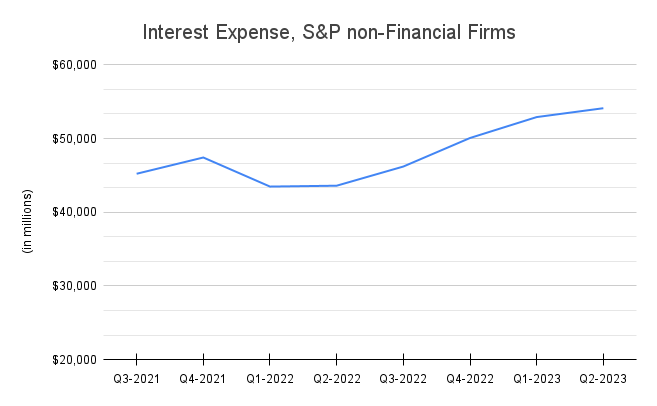
Figure 1, below, shows the total quarterly interest expense among non-financial firms in the S&P 500 (roughly 410 companies) for the last two years.

As you can see, starting around mid-2022 — right when the Fed began its series of swift and substantial rate hikes — interest expense began to climb. In total, interest expense went from $45.2 billion in Q3 2021 to $54.1 billion in Q2 2023. That’s an increase of 19.7 percent. Ouch.
Then we wondered: How much (if at all) did those higher interest costs eat into net income? So we tallied up total quarterly net income for those same non-financial firms for the same two-year period.
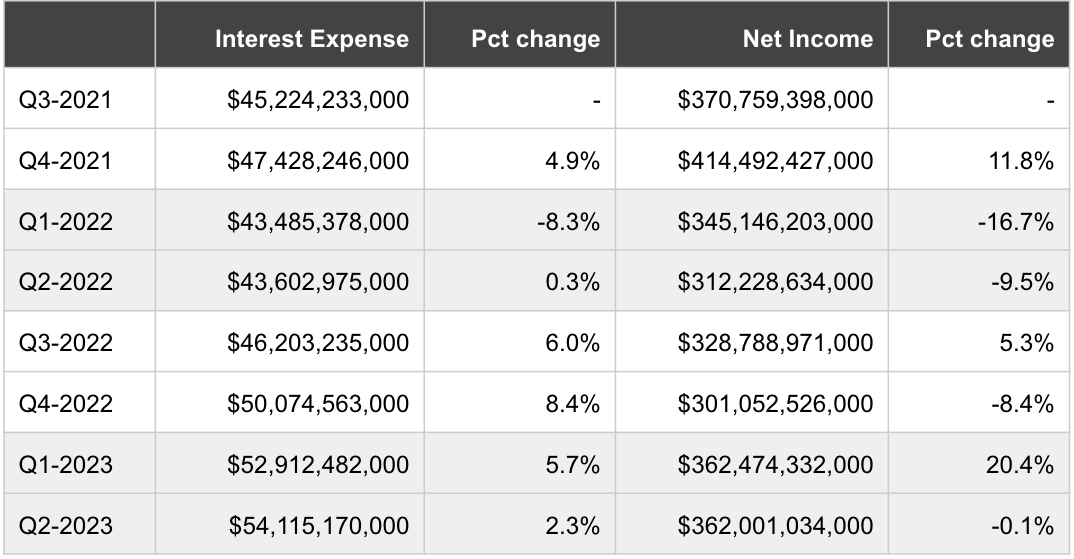
Net income is substantially higher than interest expense, so there’s no easy way to overlay both numbers on the same chart. Instead, we offer Table 1, below, which lets you see the change in interest expense and net income from one quarter to the next.

For the entire two years together, interest expense rose that 19.7 percent, while net income fell 0.2 percent — but those net income numbers are much more choppy from one quarter to the next than the interest expense numbers. (For example, without that 20.4 percent pop in net income at the start of 2023, net income growth would look decidedly worse.)
What was the point of our exercise? Mostly to sharpen everyone’s insight into the macro-economic forces at work on Corporate America, so we can all ask better questions when on those Q3 earning calls (starting in a few weeks, yay!) or just when undertaking your own research.
For example, clearly the Fed’s interest rate hikes do pressure the income statement, but companies have done a reasonably good job at not letting those costs squeeze net income. Well, how? Did the company successfully pass along higher costs to the customer? Did it cut costs somewhere else in operations to keep net income high? Did it perform some other strategic or financial maneuver to avoid the squeeze?
We at Calcbench can’t say, but the answers (or at least lots of evidence for potential answers) are out there somewhere in the data, and Calcbench has data to spare. All you need to do is look.