Another market close at the end of the week, and another update on earnings from the famed Calcbench Earnings Tracker template. This week for your consideration, we have a few interesting splits by corporate size and industry sector.
We track these earnings using our Earnings Tracker template, which pulls in financial disclosures as companies file their latest earnings releases with the Securities and Exchange Commission. The Earnings Tracker provides an up-to-the minute snapshot of financial performance compared to the year-earlier period.
In this Week 2 of second-quarter earnings season, we have 788 firms reporting. The headline numbers are below. First is Figure 1, reporting revenue…
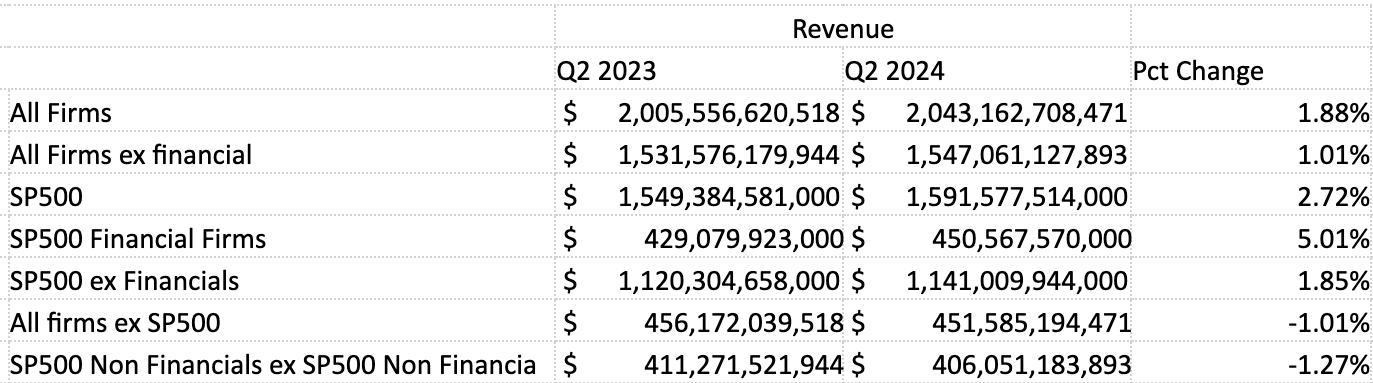
As you can see, several different tales are being told at once here. Large companies (those in the S&P 500) are doing well, with revenue up 2.72 percent if you include financial firms and still up 1.85 percent when you don’t.
Smaller companies outside the S&P 500, however, saw total revenue decline from the year-earlier period by more than 1 percent.
Can’t say we love that divergence, but what about net income? That story is even more kooky, as shown in Figure 2 (which we converted into bar graphs just to show off).
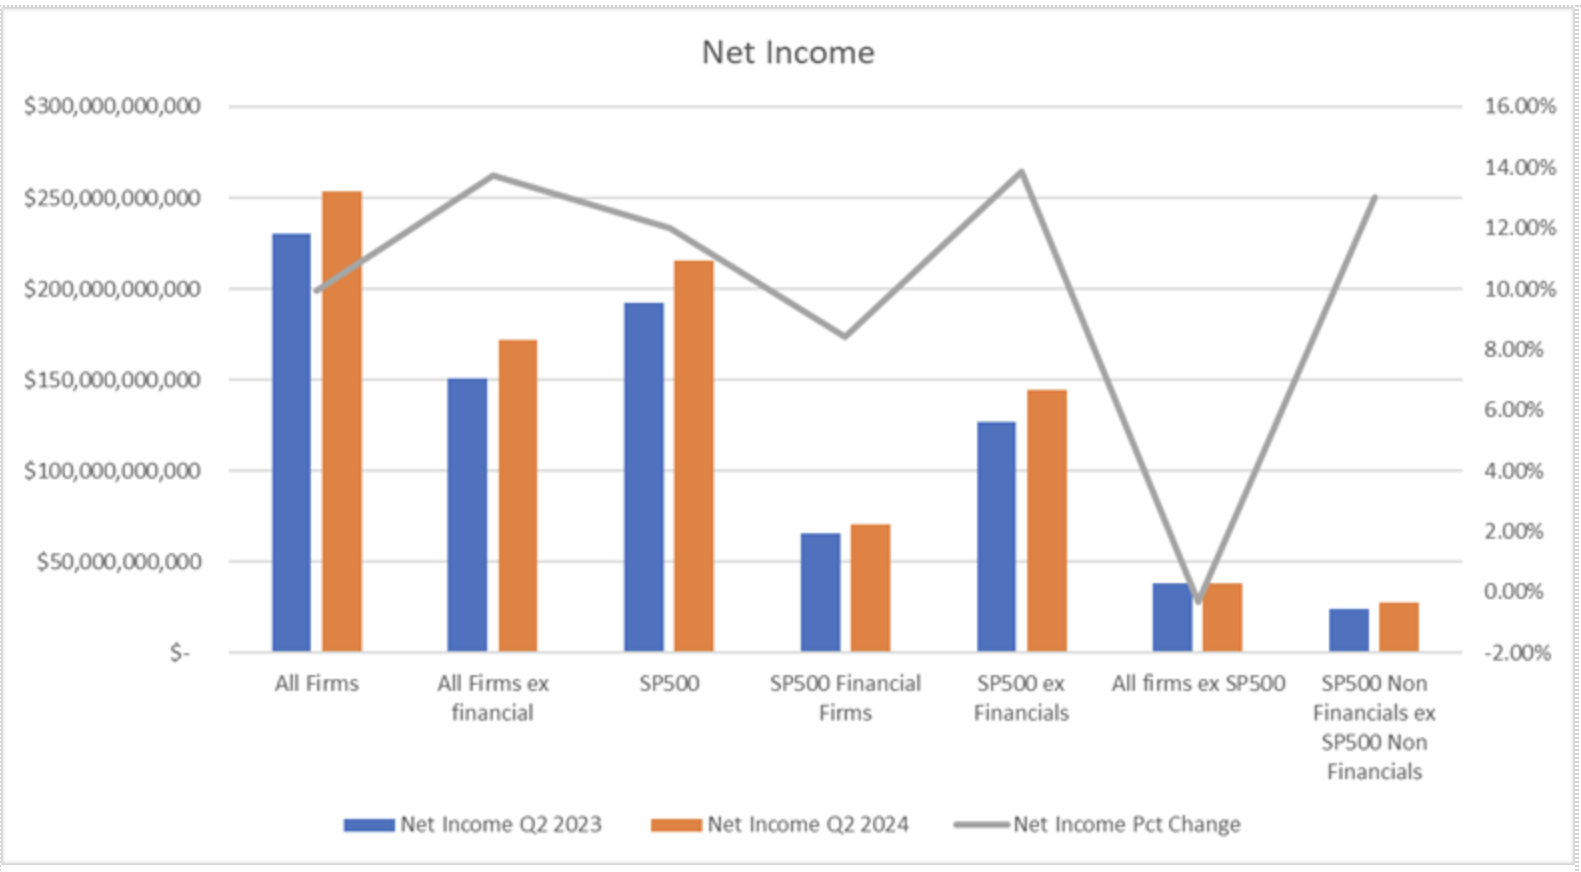
Here, smaller firms outside the S&P 500 saw net income decline by 0.33 percent. Except, when you exclude smaller financial firms, all other small filers saw net income pop by 13.3 percent — an increase pretty much equal to what all non-financial firms saw (up 13.7 percent) and all non-financial large firms (up 13.8 percent).
Large financial firms, however, saw net income rise 8.4 percent. That’s not the 13.5-ish increase for non-financial firms, but it ain’t chump change either. Which implies that smaller financial firms must still be taking it on the chin. Then again, we’re still relatively early in earnings season, so the picture may change yet again in another few weeks.
We will continue to update our earnings tracker at the end of every week for the next few weeks, as quarterly reports flood into the database.
If Calcbench subscribers wish to get their hands on the template we use for this analysis, so you can conduct your own experiments at home, use this link to the file.
Please note that it will only work with an active Calcbench subscription. If you need an active subscription (and who doesn’t, really, when swift access to real-time data is so important?), contact us at info@calcbench.com.