Today we have another example of the quirks in non-GAAP reporting courtesy of real estate firm Cushman & Wakefield ($CWK). Like so many other firms these days, Cushman discloses an adjusted financial performance metric — which, in this latest quarter, was actually worse than standard net income.
You don’t see that too often. As we documented in our Non-GAAP Adjustment Analysis published earlier this year, most non-GAAP disclosures are higher than traditional net income, but that’s not always the case. Under SEC reporting rules, a company that reports a certain non-GAAP disclosure must (a) use the same calculations for that metric period after period; and (b) keep reporting that metric period after period, until the company has thoughtful, reasonable rationale for discontinuing it.
So under the right circumstances, a company could report a non-GAAP metric that paints a less flattering picture of financial performance than standard GAAP disclosures, but you’re stuck reporting that non-GAAP number anyway.
Such was the case with Cushman & Wakefield’s second-quarter earnings report.
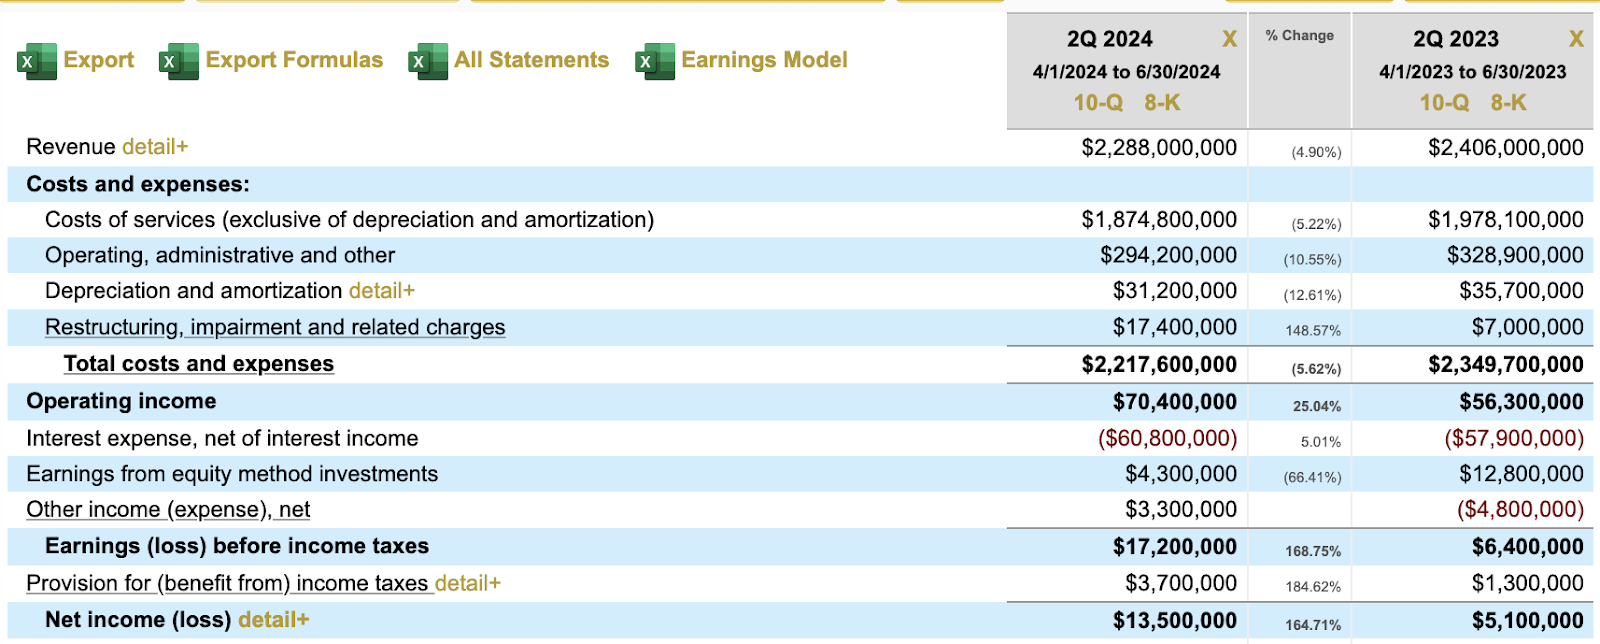
First let’s look at the GAAP numbers. Cushman reported $2.29 billion in revenue for the quarter, down 4.9 percent from the year-earlier period. Net income, however, jumped from $5.1 million to $13.5 million, largely thanks to cost savings on the operations side. See Figure 1, below.
Now we come to Cushman’s non-GAAP disclosures. Specifically, the firm reports adjusted EBITDA, which translates in the common tongue as “net income excluding a whole bunch of things.”
Figure 2, below, shows what those adjustments are. Some are the usual for EBITDA (interest, taxes, depreciation, and amortization, the “ITDA” in EBITDA) — but others are more exotic, such as cost savings initiatives, CEO transition costs, and loss or gain on disposal of assets.
As you can see, adjusted EBITDA actually declined from $146.1 million one year ago to $138.9 million this quarter.
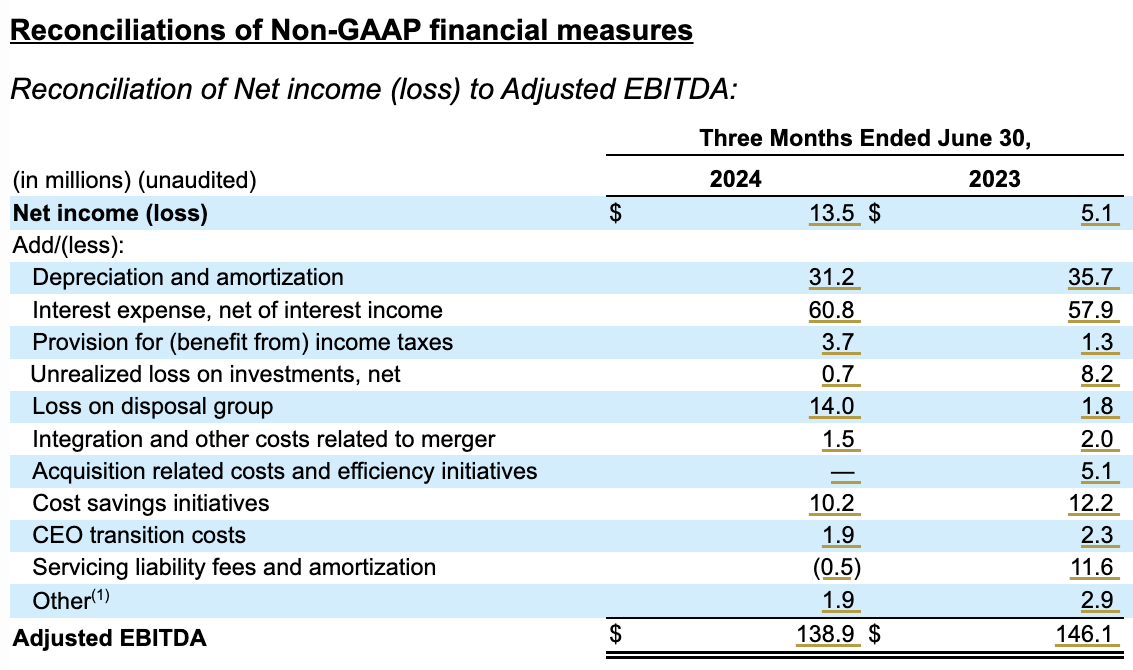
Because Cushman started a cost-cutting program last year, which included the sale of some assets, that led to markedly different — and worse — adjusted EBITDA numbers for second-quarter 2024 compared to those of 2023. Adjusted EBITDA margin and adjusted EPS declined, too.
Calcbench does let you track non-GAAP metrics, in all their quirky glory, by holding your cursor over the disclosure in question. You’ll see an Excel icon appear that allows you to “export history.” Press that, and the disclosures for that metric will be downloaded onto your desktop for easy further analysis.
We did exactly that for the adjusted EBITDA, and charted the number over time. See Figure 3, below.

All done in minutes with a few easy keystrokes. That’s the power of Calcbench!