It’s that time of year again: Calcbench and Suffolk University have released our annual analysis of non-GAAP adjustments to net income at large companies — this year bigger and better than ever!
Our study, that is. Non-GAAP adjustments to annual net income were generally not bigger and better in 2023 compared to prior years, which is our most important finding of all.
You can download the full analysis from our Research page, and don’t miss Bloomberg’s article about our findings as well.
The backstory is as follows. Every spring our research team and a squad of undergraduate accounting “winterns” from Suffolk University pore over annual earnings reports for several hundred randomly selected firms in the S&P 500. The team tallies up every non-GAAP adjustment to net income it can find, groups them by type of adjustment, and then identifies which categories of adjustment are (1) most common; and (2) the largest by total dollars adjusted.
This year we examined the 2023 earnings reports of 260 randomly selected S&P 500 firms, our largest sample size yet in the four years we’ve been studying non-GAAP adjustments. You can download the full report on our Research Page. The major findings are as follows:
- Among the 260 companies in our sample, we found 1,649 individual reconciling items with a total value of almost $182 billion.
- Companies had an average of 6.3 adjustments in 2023, a small increase from the 5.9 average in 2022 and 5.8 in 2021.
- Adjusted net income (that is, non-GAAP net income) was higher than GAAP net income by an average $698 million per company, or roughly 29 percent larger than GAAP net income.
- The average non-GAAP adjustment, therefore, was worth $110.8 million ($698 million in adjustments divided by 6.3 adjustments per firm). That is a 60.2 percent decrease from the $184 million average adjustment in 2022.
- Average adjusted non-GAAP net income was $3.1 billion, down from $3.97 billion last year. (GAAP net income saw a similar decline.)
- 86 percent of companies adjusted non-GAAP income upwards (non-GAAP income is higher than GAAP income), while 14 percent adjusted non-GAAP income downward.
- The most common adjustment was for gains and losses on investments (294 out of 1,649 total adjustments), but the largest adjustment by dollar type was for amortization of intangibles ($60.4 billion out of $181.5 billion).
In other words, non-GAAP adjustments to net income are widespread, come in all shapes and sizes, and usually add a significant amount to whatever GAAP net income the company in question is reporting.
All of which points, yet again, to a question that the financial reporting community has been asking for years: If so many companies are reporting adjusted non-GAAP income, is “traditional” net income under GAAP really that informative?
That is not Calcbench’s place to say — but we do have all the data you need to ponder that question yourself.
Non-GAAP Adjustments by Category
Table 1, below, shows the various categories of non-GAAP adjustments that we identified, along with how often those adjustments were made, their dollar amount, and the relative size of each category to the whole.
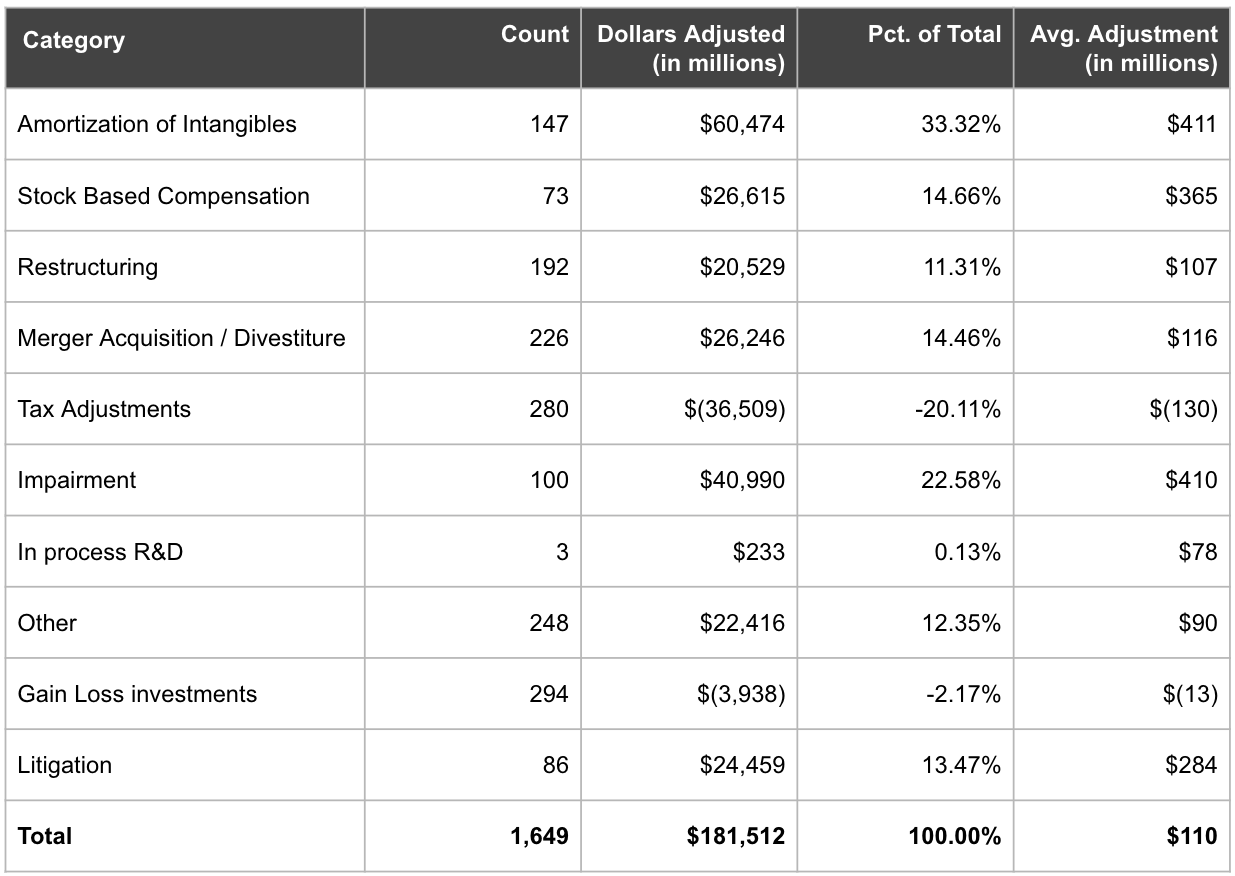
As you can see, the most common categories of non-GAAP adjustment were, in order (and excluding the “Other” category):
- Gains and losses on investments (including pensions)
- Tax adjustments
- Mergers, acquisitions, and divestitures
- Restructuring costs
- Amortization of intangible assets
Interestingly, the above sequence for 2023 adjustments is unchanged from 2022 adjustments.
On the other hand, the largest categories of adjustment by total dollars adjusted for 2023 were, in order:
- Amortization of intangibles
- Impairments
- Stock-based compensation
- Litigation
- Mergers and acquisitions
Here, we did see some re-arrangement compared to 2022’s sequence. In that year, impairments placed first followed by amortization of intangibles, while adjustments for stock-based compensation, litigation, and gains and losses on investments didn’t even crack the top five.
Broadly speaking, then, we can conclude that the most common types of non-GAAP adjustments have held steady over the last several years, even though the dollar amounts for those adjustments can vary considerably from one year to the next.
Again, you can download our complete non-GAAP report on the Calcbench Research page, and we’ll have more posts about our findings later this week.
And we very much thank Suffolk University’s winterns, without whom this research never would have been possible!