A few weeks ago at Calcbench, we published a report on Operating Leases in the S&P500. The picture below is an illustration of why we think this topic is relevant and more to the point, shows the leverage that exists in the retail sector. This leverage doesn’t sit on the balance sheets of firms.
Is this a problem? Perhaps. But if you are delving into the profits of retailers, it is a detail that you cannot ignore.
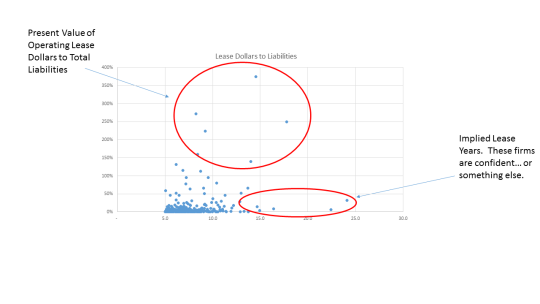
On the y-axis of the above graph are the firms with the highest operating lease commitments (present valued and in dollars) to total liabilities on their balance sheet.
The top 10 firms in order are:
- Chipotle Mexican Grill Inc
- Urban Outfitters Inc
- Whole Foods Market Inc
- Tractor Supply Co
- Family Dollar Stores Inc
- Walgreens Boots Alliance, Inc.
- Dollar Tree Inc
- Gap Inc
- Ross Stores Inc
- Tjx Companies Inc
On the x-axis of the graph are the implied lease years exist for each firm. This is found by taking average of the dollar amounts of the operating leases in years 1 through 5 and dividing that number into the thereafter number. So in the case of Whole Foods Market, you will find that in 2014, they declared that there were 5.95 billion dollars of operating lease commitments in the years after 2019. Based on an average annual expense of $465 Million in operating leases from 2014 through 2019, we find that there are (5948/464.8) or 12.8 years of payments beyond 2019, so roughly 17-18 years of leases on average.
The top 10 firms in terms of implied years of operating leases are below:
- KOHLS Corp
- Target Corp
- Whole Foods Market Inc
- Costco Wholesale Corp
- Firstenergy Corp
- Macy’s, Inc.
- Chipotle Mexican Grill
- Walgreens Boots Alliance, Inc.
- Pinnacle West Capital Corp
- Vertex Pharmaceuticals Inc
What does this all mean? Aggressive management? Smart financing? Something else? Get in touch if you want my opinion.