Calcbench is known for delivering detailed numbers and text from the primary financial statements and footnotes section of annual and quarterly filings.
However, over the last year we’ve expanded our focus. Last fall we added text from earnings press releases (8-K) and proxy statements (Def-14A) to our interactive disclosure viewer.
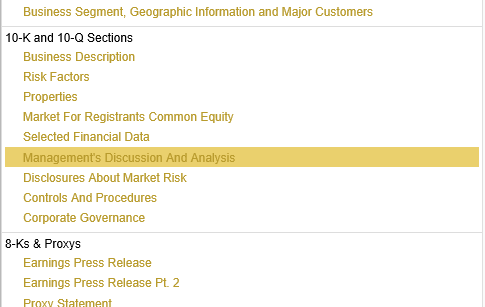
And last week, we are pleased to say, we added other parts of the annual and quarterly filings, beyond the standard statements and footnotes. These include the Management’s Discussion and Analysis, the Business Description, Risk Factors, and more.

In the near future we hope to also bring you some of the important numbers from these new areas as well. (But in the meantime we’ve made it easy for you to quickly extract numbers on your own into Excel).
Let’s take a deeper look at one of these sections, the MD&A.
In every 10-K or 10-Q, companies need to report a whole checklist of information that is strictly defined by the SEC and FASB. However, in one place they can use their own words and metrics to explain their results and describe what is happening at the company. This is the Management’s Discussion and Analysis of Financial Condition and Results of Operations.

From a numbers standpoint, here you’ll find a variety of company specific performance metrics, like ‘comparable store’ sales changes, subscriber ‘churn’, order backlog, customer acquisition costs and ‘ARPU’, detailed geographic breakouts, and results by product line. The important thing to remember about these numbers is they are not strictly defined, so their definitions and usage will vary from company to company.
A great way to learn about a new company is to go back a few years and look at this section, and how it changes over time. How have things changed? Does management stick to its story year after year? Do they deliver the results they promise, or do they make excuses?
You may have heard recently (on this blog, or in the news) discussion over ‘Non-GAAP financial measures’, like ‘Adjusted Net-income’. Outside of the company’s earnings press releases, the MD&A is the other likely place you will find these measures used. (And if they are, you should also find the required reconciliation to their GAAP counterparts). These measures are used by management to try to explain their core business trends by excluding certain items. But investors and regulators accuse some companies of using them to sugar coat their results