U.S.-listed firms are required to follow U.S. Generally Accepted Accounting Principles (GAAP) when reporting their financial statements. Firms are also allowed to present additional figures that don’t follow GAAP — metrics commonly known as “non-GAAP.”
When doing so, the firm must also explain how it arrived at the non-GAAP figure, and show a reconciliation (including the adjustments made) back to the closest comparable GAAP metric.
In a recent Calcbench research report, we examined the size and nature of adjustments S&P 500 companies made to their GAAP figures, to arrive at the most commonly used non-GAAP figures. Today we want to examine the trends of those differences.
First, we identified all companies that report non-GAAP earnings per share (EPS), roughly 1,700 firms. Then we examined the median difference between the non-GAAP EPS and the corresponding GAAP EPS.
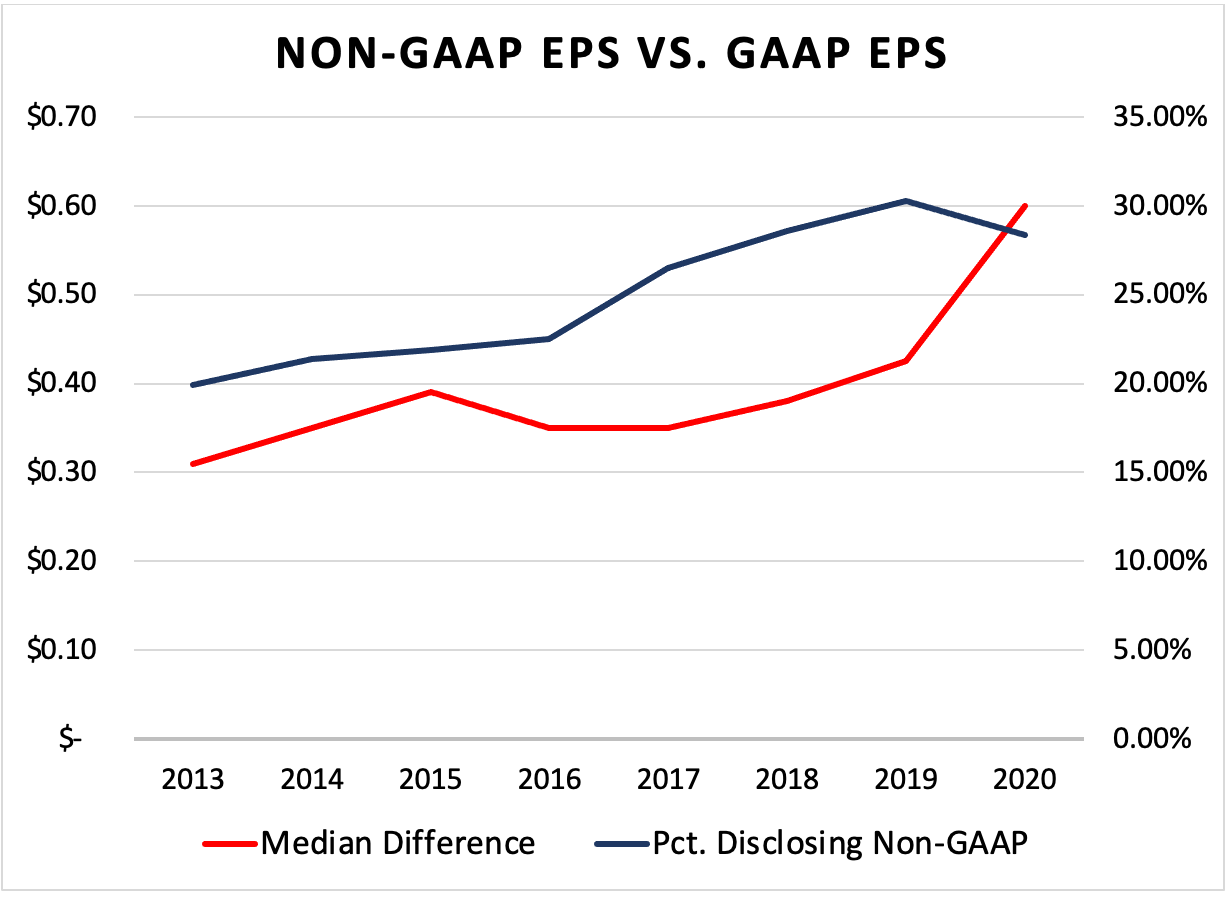
One interesting note is that the percentage of companies reporting non-GAAP EPS has increased significantly, from about 20 percent of all firms in 2013 to 30 percent in 2020. This would suggest that investors find the non-GAAP information important, and push companies to disclose it.
Meanwhile, the median difference between non-GAAP and GAAP EPS has doubled, from roughly $0.30 per share in 2013 to $0.60 in 2020. The non-GAAP EPS is higher (little surprise there), and the gap between the non-GAAP EPS and GAAP is increasing
.

Does this mean GAAP numbers are less important, or that non-GAAP amounts are more informative? We don’t know, but the increasing gap is interesting.
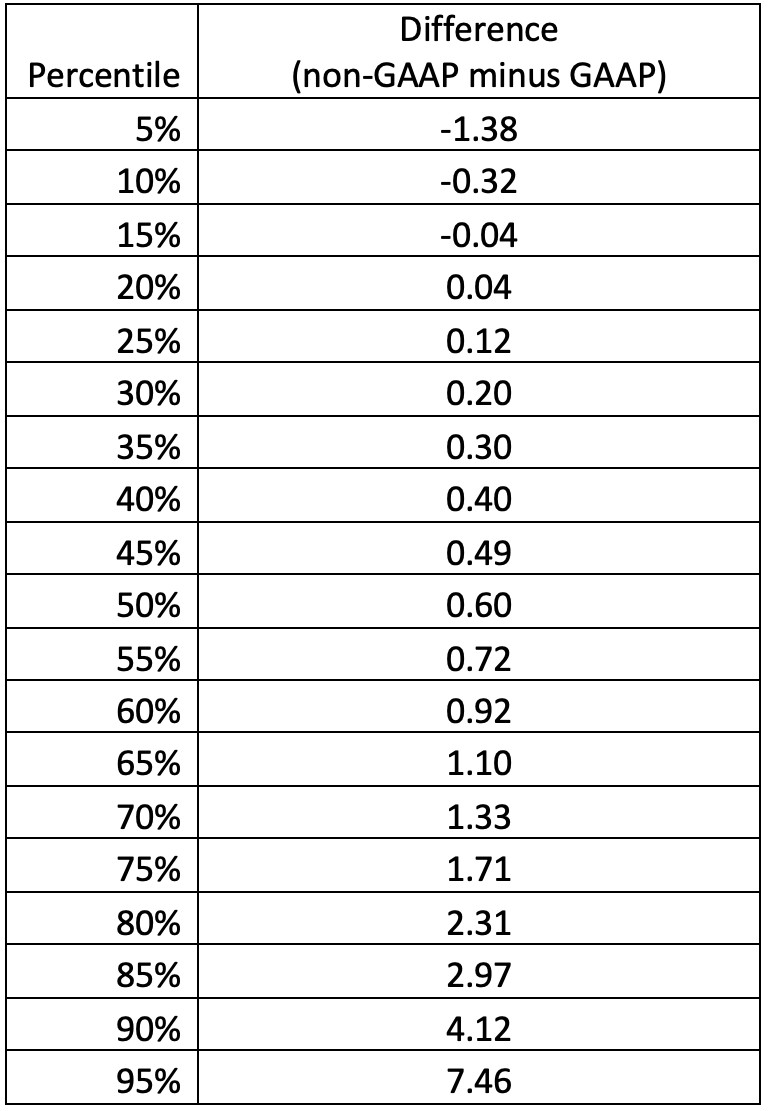
We further examined the distribution of differences between GAAP and non-GAAP EPS for 2020. As you can see from the table below, 80 percent of companies report a non-GAAP EPS that is higher than the GAAP EPS, whereas only 20 percent report a non-GAAP EPS lower than the GAAP EPS.

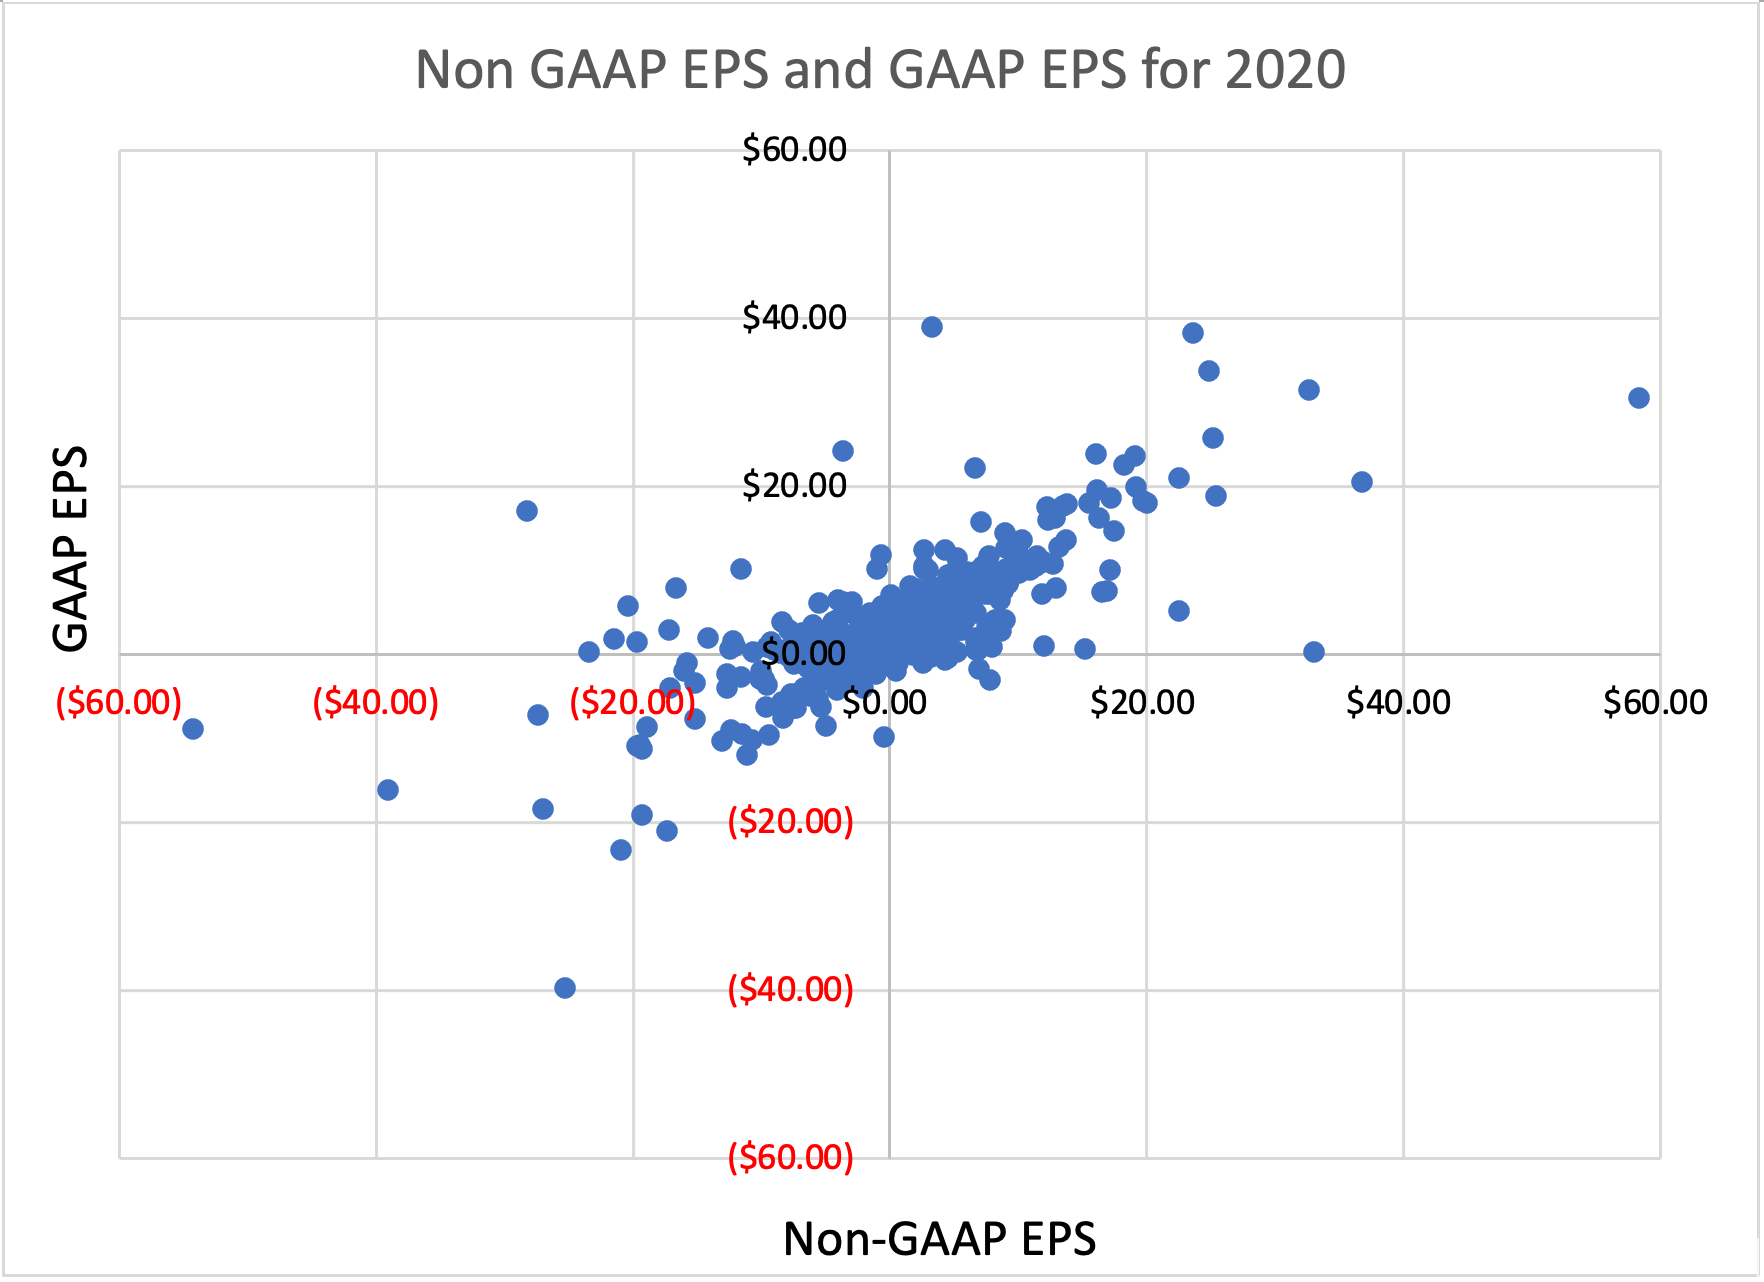
We wanted to further examine the relationship between the GAAP EPS and non-GAAP EPS, so we plotted the EPS numbers for 2020 in a scatter plot, shown below.

As you can see from the chart, GAAP and non-GAAP EPS largely move in similar directions. Still, you also see some cases where the two seem to differ substantially. There seem to be cases in the above chart where the dot falls below the 45-degree line. Those would be cases where non-GAAP EPS is lower than GAAP EPS.
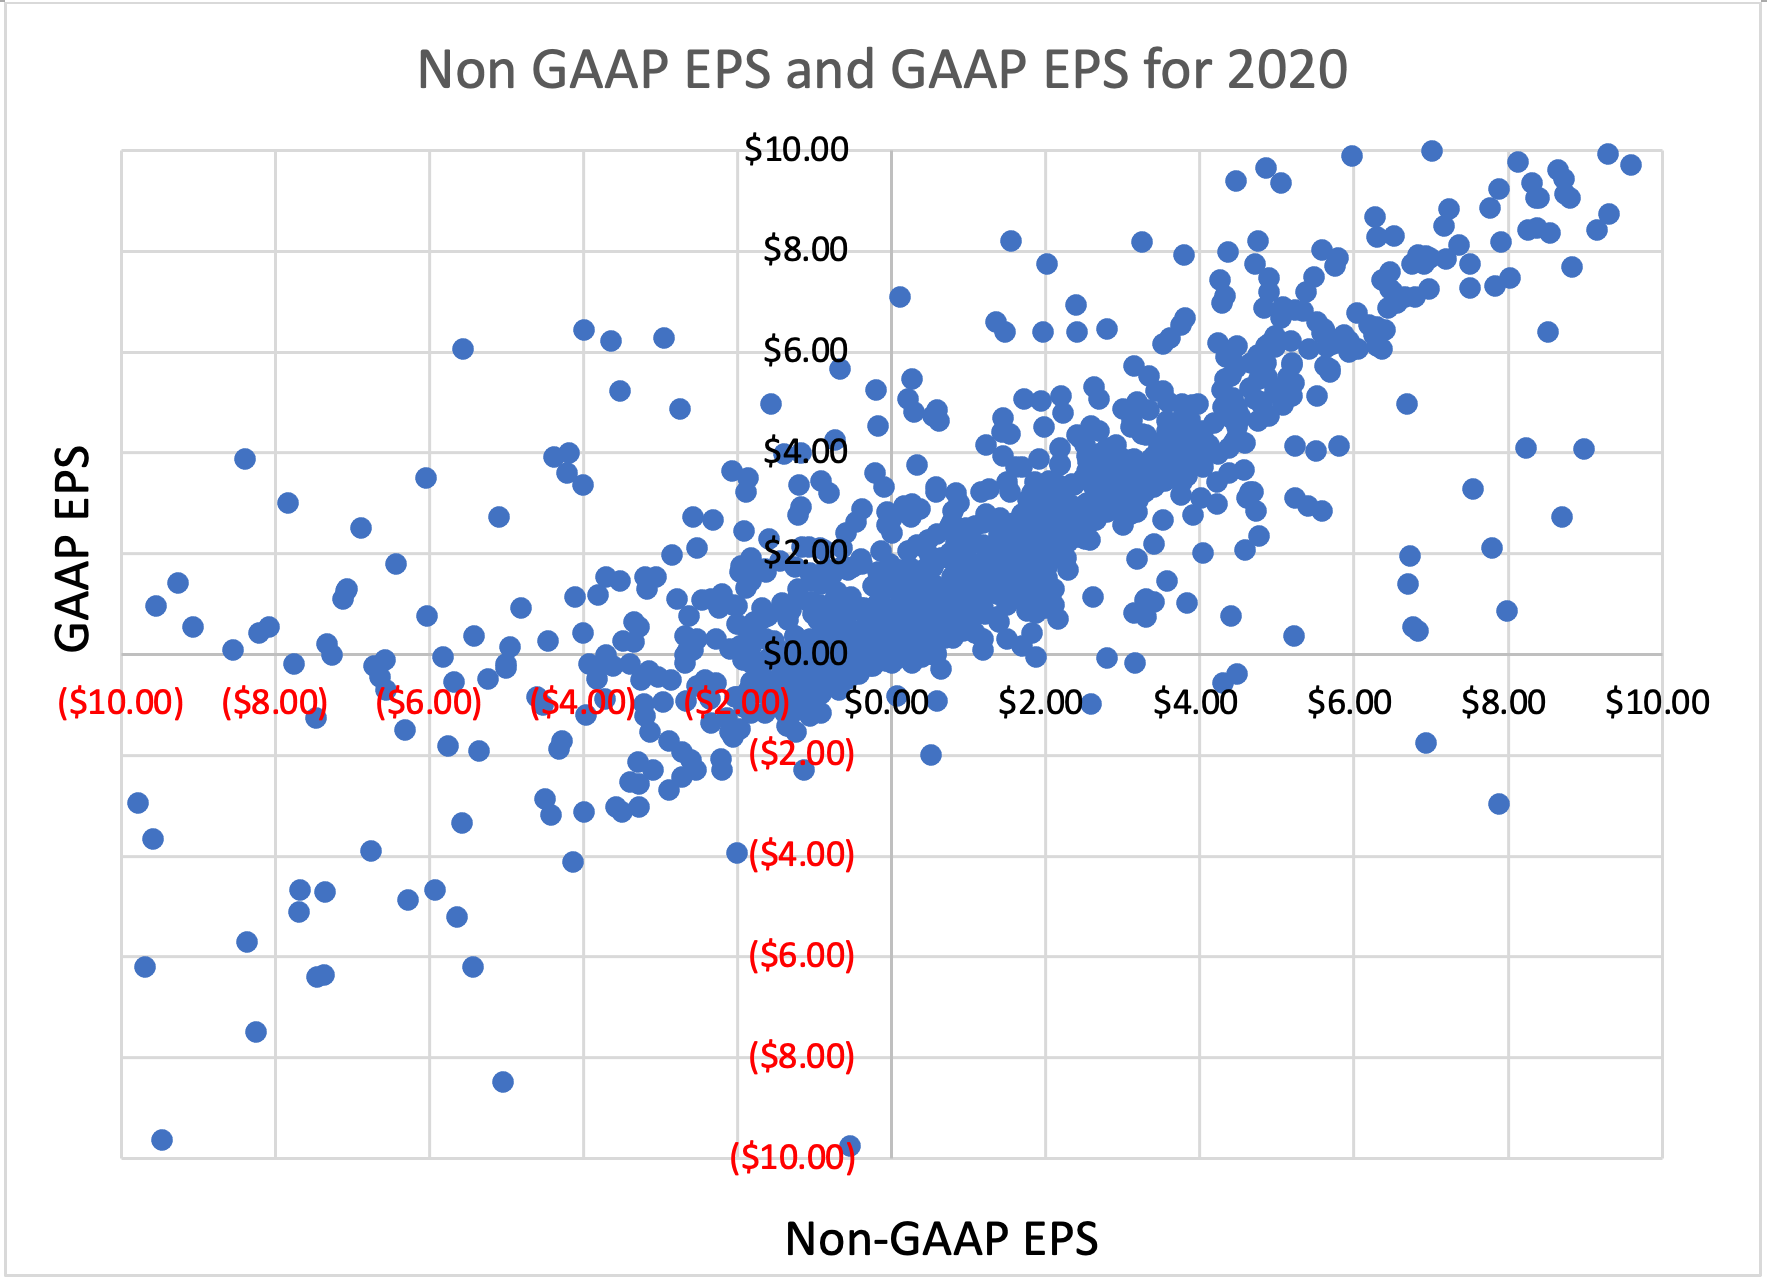
Then we zoomed in to focus on EPS values of $10 or less. In the chart below you see a similar story to the one we saw for the entire population, with the exception that there seem to be many more cases above the 45-degree line — that is, where non-GAAP EPS is higher than GAAP EPS.

Want more? Calcbench has all the data. Go to our Multi-Company database page to see the data. (Caveat: non-GAAP data is available for Professional-level Calcbench subscriptions only).