One of the country’s top banking regulators published a report last week looking at various risks to the financial system. One issue the report flagged was the growing amount of debt at non-financial companies.
Loyal readers of this blog know the drill by now. We wondered, how much debt has Corporate America been racking up lately, anyway? With a few quick keystrokes, we pulled up the answer.
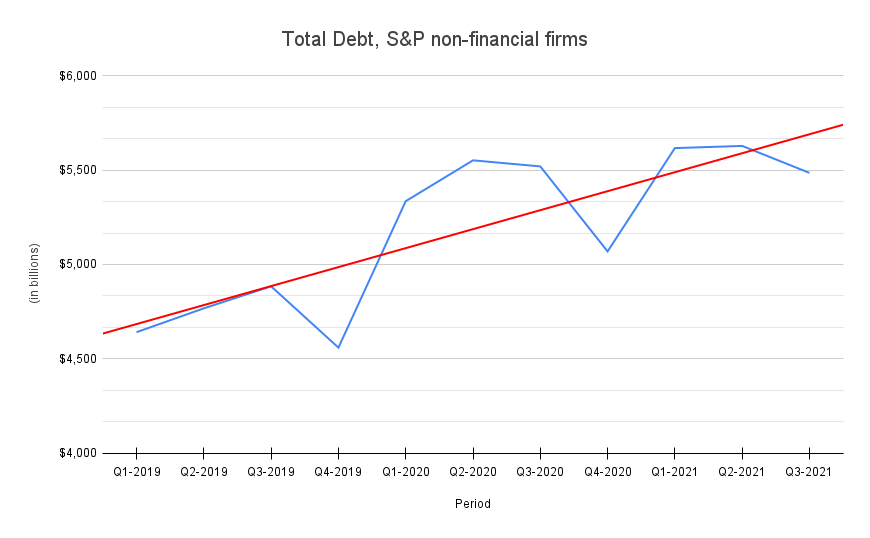
Figure 1, below, shows total debt among 410 non-financial firms in the S&P 500 since the start of 2019.

Total debt among these firms rose 18.2 percent, from $4.64 trillion at the start of 2019 to $5.48 trillion in Q3 2021. Note the bulge in borrowing that happened in first-half 2020.
On several levels that’s not surprising. First, plenty of companies borrowed cash simply to assure that they could keep going during the pandemic; there was real fear and uncertainty about liquidity. Second, even among businesses that had a strong financial position, the Fed had cut interest rates to rock-bottom levels — so why not borrow while money was so cheap?
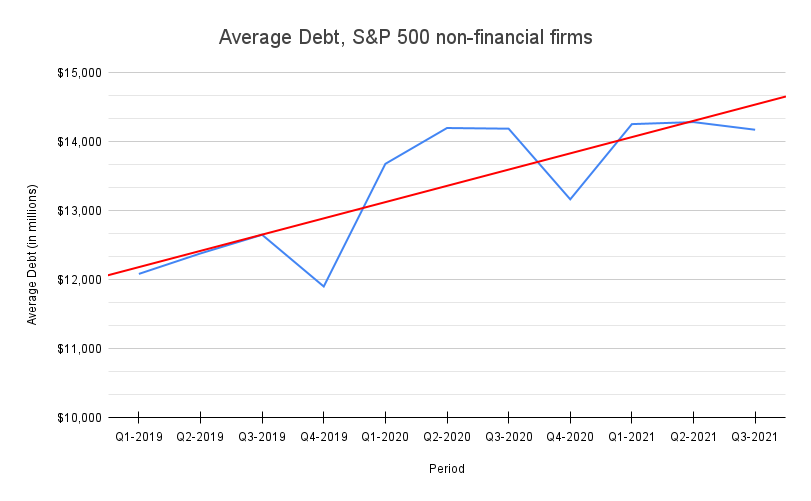
Figure 2, below, shows the trend in average debt load among the same companies, and tells much the same tale. Average debt per firm rose 17.3 percent, from $12.1 billion at the start of 2019 to $14.2 billion by Q3 2021.

Same bulge in the first half of 2020, same tapering toward Q3 2021, and almost the same slope of the trend line over time.
Debt and Calcbench Data
Calcbench users can research debt levels in multiple ways, both at individual firms and among large groups of firms altogether.
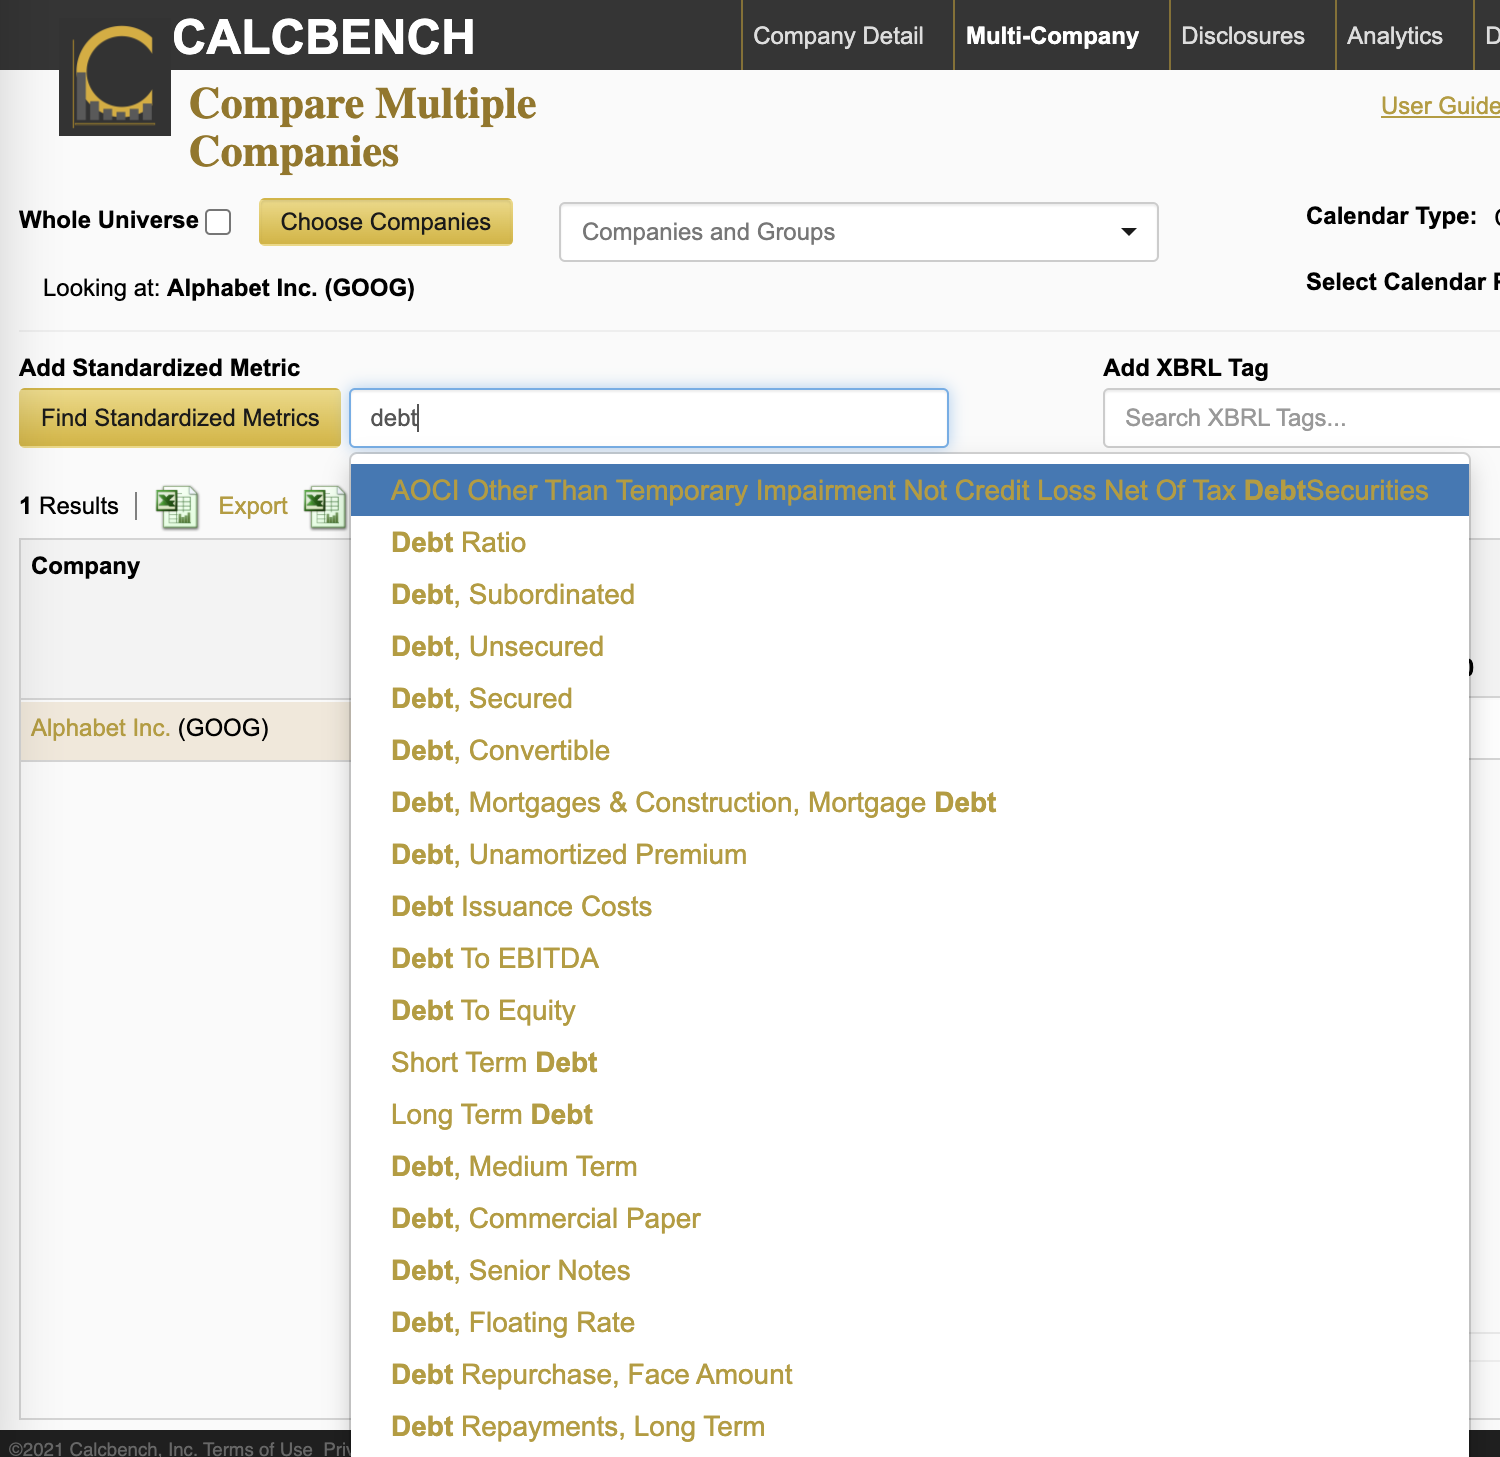
As always, one good place to start is at our Multi-Company page. That page allows you to search our set of standardized disclosure metrics, and we have numerous such metrics related to debt: long-term debt, short-term debt, total debt, floating rate debt, commercial paper debt, and many more.
Figure 3, below, shows the choices that come up when you enter “debt” into the search field, and that list is nowhere near complete.

On the Multi-Company page, you could also add other standardized disclosures to your search, if you want to track debt relative to some other number — say, revenue, or assets, or cash from operations.
You can also use the Interactive Disclosures page to research specific firms and their disclosures about debt, which are often voluminous and richly detailed. For example, we pulled up the latest quarterly report from Google ($GOOG) and looked at its debt disclosures. Figure 4 is a sample of what you see.

Remember that for any highlighted number, you can move your cursor over that number to see its XBRL tag and you have an option for “See tag history.” Click on that option, and a box will open to show what the company reported for that disclosure in prior periods. So for example, one could hover over those long-term debt numbers ($14 billion at the end of 2020, $13 billion at the end of September 2021) to see a much longer history of what Google had been reporting.
And we’d be remiss if we didn’t also suggest that you skim the Management Discussion & Analysis disclosures, to see whether you can find any important, additional context there. For example, some firms might be racking up the debt to complete a lucrative merger; others might be racking up debt because they needed the cash to stay operative during the pandemic. Unto itself, total debt is not necessarily an informative metric — you need to know the context.
Thankfully, Calcbench has both. The rest is up to you.