Everybody likes to speculate about mergers, so today let’s have some fun. With all the cash that the largest publicly traded S&P 500 firms have at their disposal, how many other S&P 500 firms could those big fish buy if they wanted to do so?
After all, it’s no secret that some firms have so much cash and short-term equivalents that those holdings are larger than the entire market cap of other firms. So Calcbench decided to quantify that concept, by comparing S&P 500 firms’ total cash and short-term equivalents against market cap as of Dec. 31, 2021. That gives us a sense of how much acquisition power those largest, richest firms truly have.
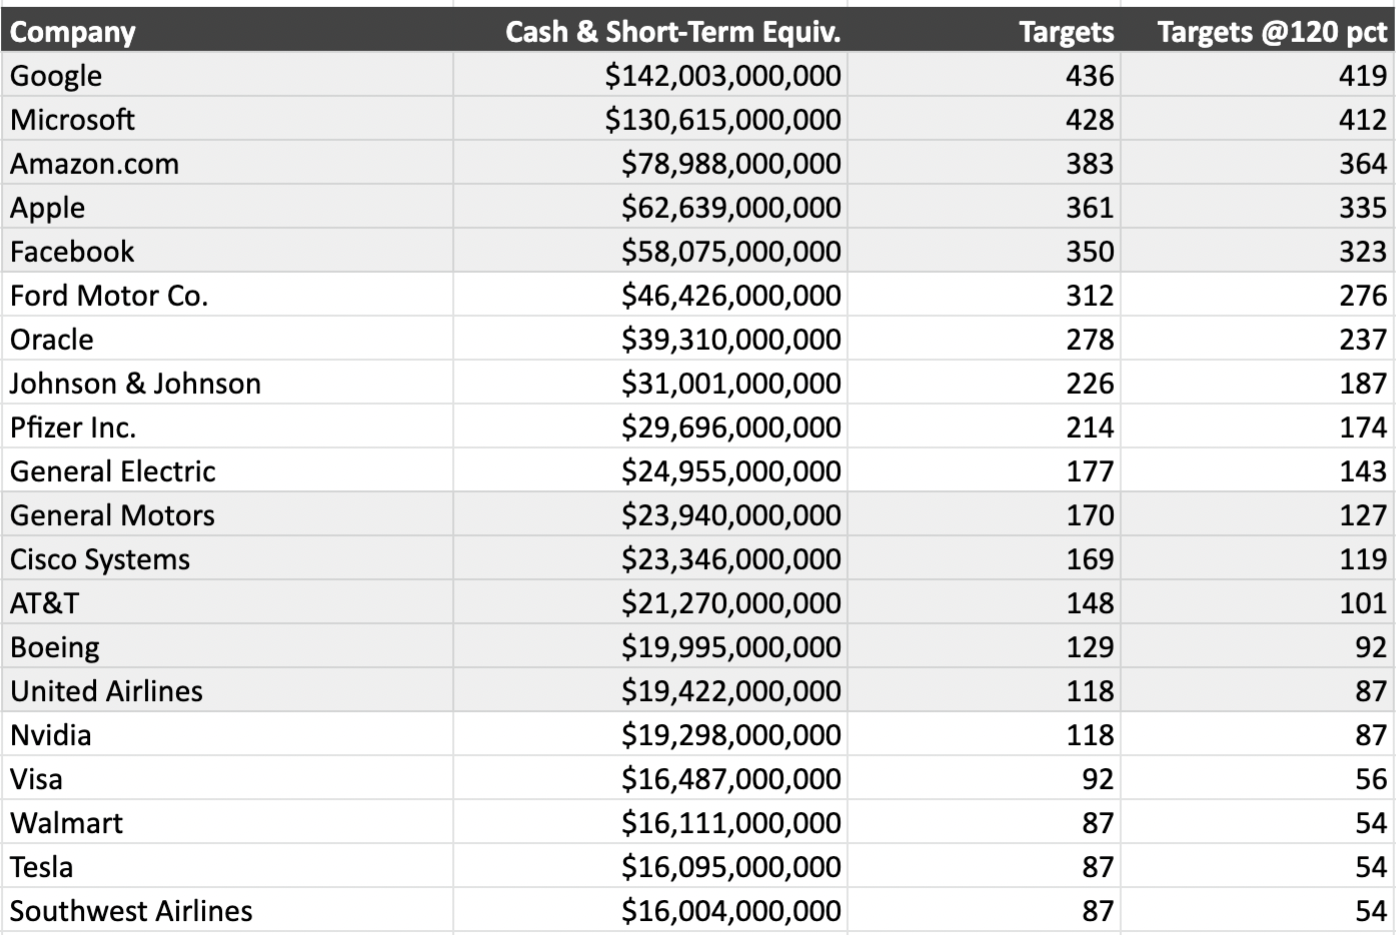
Table 1, below, is the result. These are the 20 non-financial S&P 500 firms with the biggest piles of cash and short-term investments at the end of Q3 2021; and the number of other S&P 500 firms those top 20 theoretically could buy, based on the market cap of the smaller firms as of Dec. 31, 2021.

In other words, Google had enough cash and short-term equivalents last quarter to buy any one of 436 firms within the S&P 500. We even added another 20 percent to the market cap of all firms, since most acquisitions do happen at a premium over the target’s market value — and Google could still buy any of 419 other firms within the S&P 500!
What’s most striking is that the five firms with the largest cash piles, able to buy the most other S&P 500 firms, are all Big Tech companies. That’s an extraordinary amount of potential purchasing power, even if those five firms have other ideas for the money.
Indeed, when you think about it, that would be an excellent question for an analyst to ask on an earnings call: What does the company plan to do with so much cash? Mergers? A one-time dividend? Reinvestment in operations? Investment in startups? Or will the company keep sitting on piles of cash until further notice?
While we’re on the subject, some firms have even more potential buying power locked up in long-term marketable securities — that is, financial assets that could be converted into cash, just not immediately and perhaps not at current market value.
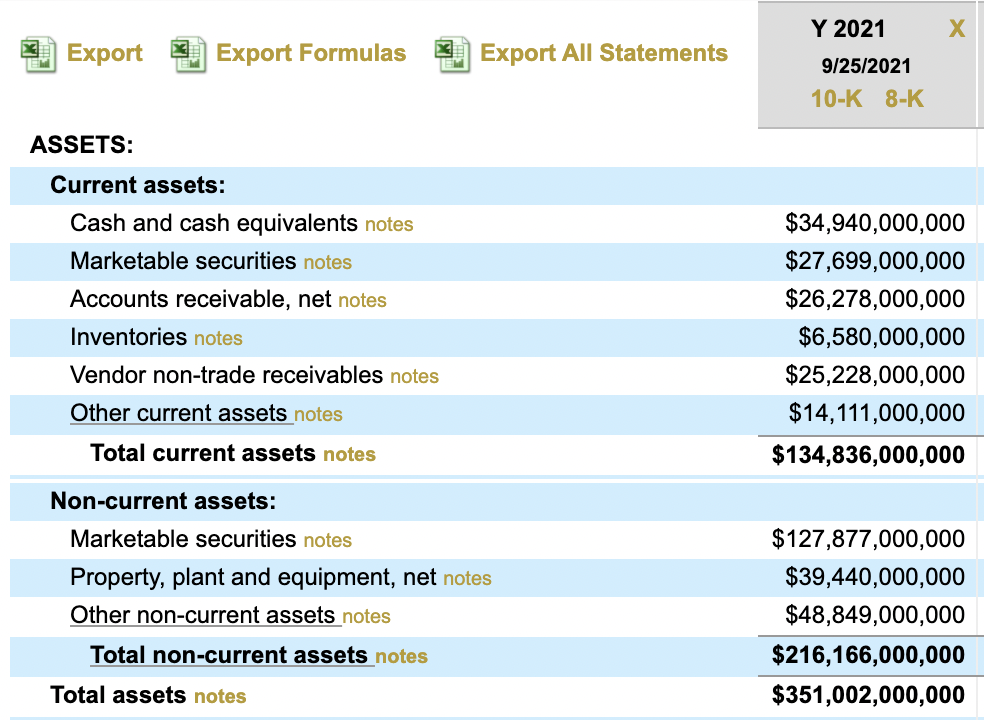
Let’s look at the balance sheet of Apple ($AAPL) as an example:

Apple has $34.94 billion in cash and cash equivalents; plus another $27.7 billion in current marketable securities. That gives us a total of $62.64 billion, which places Apple fourth on our table above.
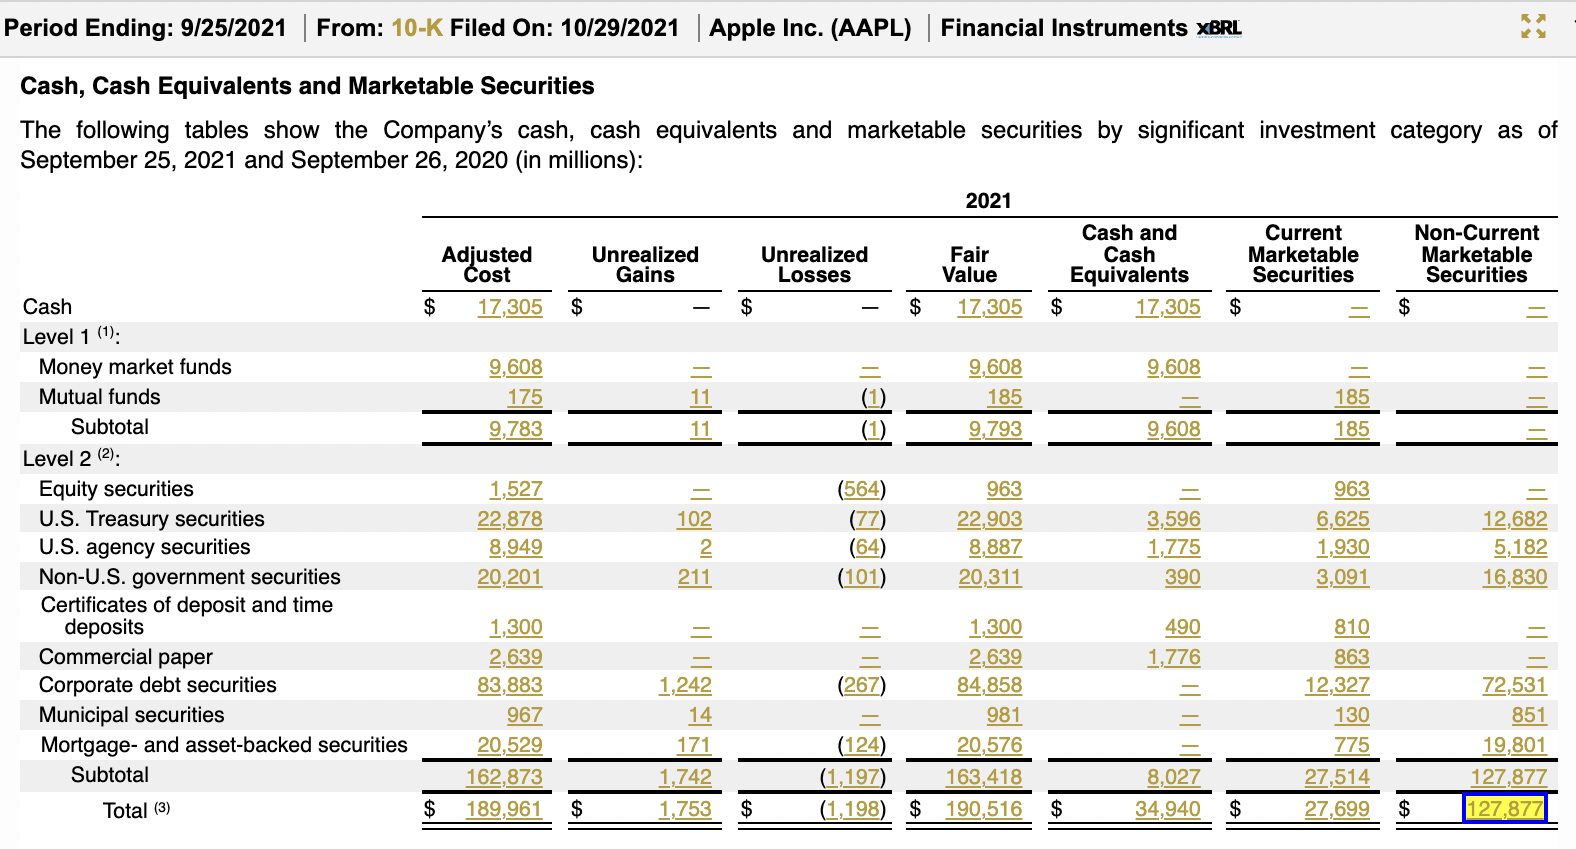
But Apple also has another $127.88 billion in non-current marketable securities. What are those? We used the Calcbench trace function, and found this breakdown in Apple’s footnotes (the non-current assets are listed in the right-side column):

The $127.88 billion is a collection of securities that presumably have long-term maturity dates. Perhaps a company could sell such assets to a private party to raise cash, but that would take time and the sale might happen at a discount to face value. So the line-item is interesting to note, but not directly relevant to our purposes here today.
Then again, who cares? The numbers from Table 1 alone show that the biggest fish in the market aren’t just big; they’re huge.