Peloton might be famous for its Internet-connected treadmills and exercycles — but if its latest annual report is any indicator, let’s just hope the company doesn’t end up better known on Wall Street as a punching bag.
As you might recall, Peloton ($PTON) announced last month that it needed to delay the filing of its annual report to sort out accounting related to a recently adopted restructuring plan. That annual report finally arrived Wednesday morning. So what bits of financial data are tucked away in that report, that might give analysts a fuller picture of Peloton’s future?
The headline numbers do not look good. Annual revenue fell from $4.02 billion to $3.58 billion, a drop of 10.9 percent. The cost of revenue, however, actually rose $2.56 billion to $2.88 billion. Then came increases in costs for sales, marketing, R&D, and administrative costs; plus a goodwill impairment and a restructuring charge. Add everything up, and Peloton suffered a pretax operating loss of $2.81 billion.
OK, so is there any good news in Peloton’s report? Perhaps.
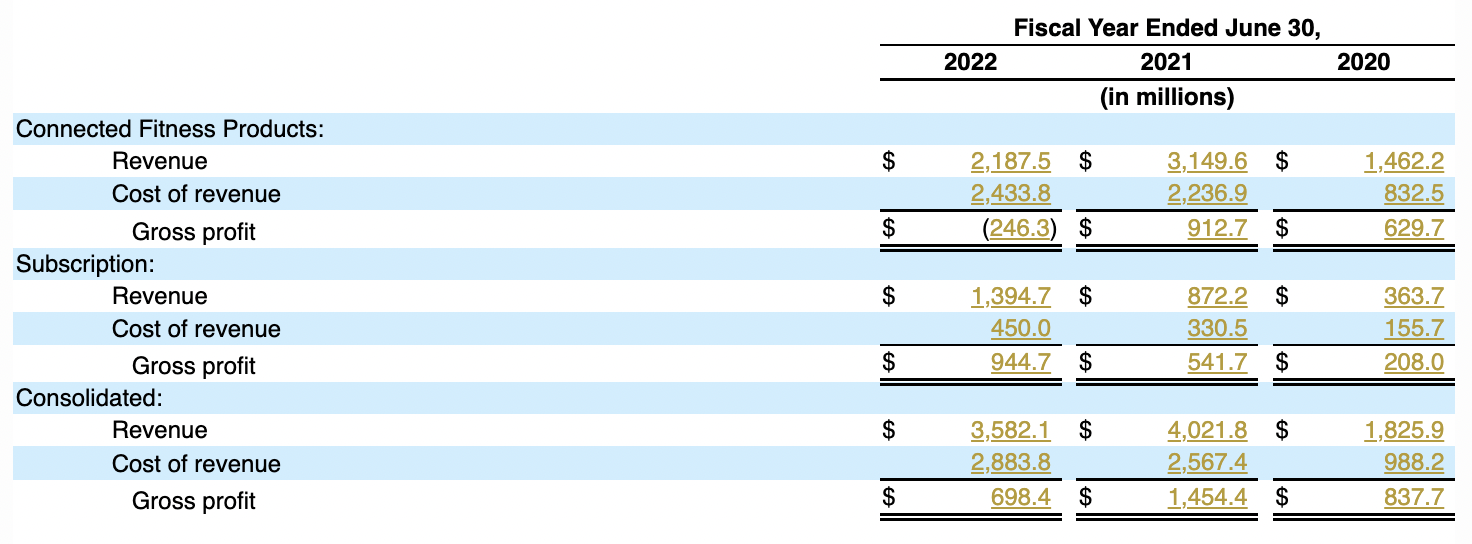
The company also reported revenue by two operating segments: those fitness products that increasingly end up as modern art in your living room; and ongoing subscription revenue from those few health nerds who do still use their Peloton products as intended. Figure 1, below, shows the breakdown of revenue by those two segments.

There, in the subscription segment — revenue growth, and lots of it! Even better, gross profit margins increased too, from 62.7 percent in fiscal 2021 to 67.7 percent this year.
Those numbers are important because they’re crucial to Peloton’s restructuring plan. That plan, announced in February, essentially gets Peloton out of the equipment manufacturing business, leaving the company to focus on subscriptions and related high-end services. With growth and margins as seen in Figure 1, perhaps there’s mileage in that idea after all.
Restructuring
To pull off that plan, however, Peloton still needs to shed a lot of assets. So how’s that going?
Figure 2, below, gives us a sense of things. The line items for inventory and property, plant & equipment have both been trending downward since earlier this year, just when Peloton first announced its plan.

That said, you can find even more detail about inventories and PP&E in the footnotes. For example, in Figure 2, inventories are listed at $1.104 billion. Figure 3, below, shows precisely how that number breaks down.

Finished products in inventory actually rose over the last year, from $879.5 million to $1.3 billion. So while the overall strategy of shifting to subscription services might seem promising, Peloton still has a lot of fitness equipment it needs to sell — at a time when sales of that segment are falling.
We previously wrote about inventory-to-sales ratios as an omen of price discounts in the retail sector; that phenomenon might strike at Peloton, too.
Meanwhile, like rats on a treadmill, we at Calcbench keep collecting and studying the data!