First-quarter 2023 ends this week. That means first-quarter earnings reports will start arriving a few weeks after that, and in recent years the large banks have been the first companies to file their quarterly reports.
So, since everyone is kinda sorta unnerved that maybe there’s a banking crisis afoot, Calcbench offers this quick refresher on where in the footnotes a financial analyst might look for useful disclosures about bank health.
Specifically, some banks include footnotes entirely dedicated to their deposits. What do those footnotes tell us?
Let’s start with Citigroup ($C). The bank included a deposit footnote in the 10-K it filed on Feb. 27 that offered three tables explaining the amount of deposits, the change in deposit amounts from one year to the next, total deposits inside and outside the United States, and more.
For example, Figure 1, below, shows that total deposits rose from $1.317 trillion at the end of 2021 to $1.365 trillion at the end of 2022, an increase of 3.7 percent. A majority of that increase came from branches inside the United States ($28.3 billion) rather than branches outside the United States ($20.4 billion). And to little surprise, the large majority of deposits are in interest-bearing accounts rather than non-interest accounts.

Even more interesting, Citigroup includes a breakdown of “time deposits” (read: certificates of deposits) whose denominations exceed the $250,000 limit on deposit insurance. See Figure 2, below.

What can analysts do with disclosures like this? For starters, you might use this data to help you understand a bank’s interest expense — the money it pays to depositors who hold interest-bearing accounts. The higher interest rates go, the more money people deposit into savings accounts, and the higher a bank’s interest expense climbs. (Banks do report interest expense as its own line-item on the income statement, of course.)
As for deposits that exceed insurance limits, that disclosure might give you a better sense of the risks that a bank poses to the larger financial system. After all, the heart-attack moment for Silicon Valley Bank’s collapse was the realization that almost all its deposits exceeded federal deposit insurance limits, so most depositors were potentially looking at financial ruin.
Clearly such a scenario is much less likely for a giant such as Citi, which has larger capital reserves and “failure risk” that is negligible. But mid-sized banks might paint a very different story.
Other Examples
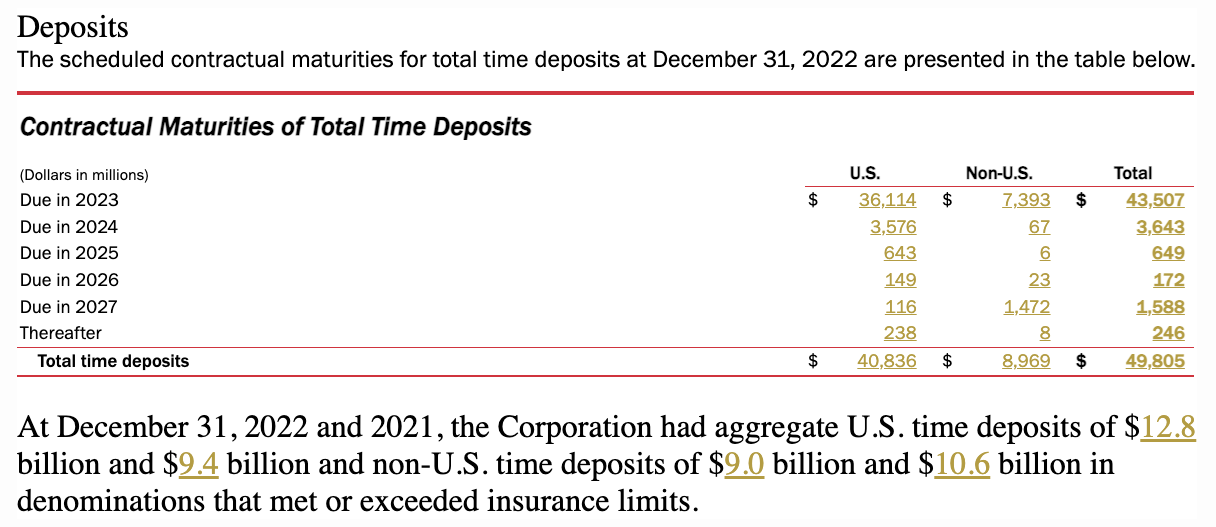
Not all banks are as chatty about their deposits as Citi. Bank of America ($BAC), for example, offered only one table about the maturity of CDs in the 10-K report the company filed on Feb. 22. (See Figure 3, below.)

On the other hand, U.S. Bancorp ($USB) provided a table that listed deposits by savings account, checking account, money market accounts, CDs, and non-interest accounts. (See Figure 4, below.) Do the math, and you’ll find that the biggest increases came in CDs (up 45 percent) and money market accounts (up 26 percent) — which happen to be the accounts that offer the best interest rates. Who woulda guessed?

Finding these disclosures in Calcbench is easy. Simply open our Disclosures & Footnotes database, select the bank (or banks) you want to research, and then look for a “Deposits” footnote among the many disclosures listed on the left-hand side of your screen.
As we said, the exact disclosures will vary from one bank to the next, and some banks (mostly smaller ones, from our cursory research) might offer no such disclosures at all. But among those banks that do, you’re likely to find some fascinating nuggets of data that you can use (along with other disclosures the banks make, such as interest expense and net interest income) to drive your analysis of which banks are doing well these days.
First-quarter reports will be arriving by late April. Start planning your models now!