Everyone likes to say cash is king, so we have mixed news on that front from the Calcbench macro-economic analysis department: plenty of companies have been generating more cash from operations in the last few years, despite the pandemic and inflation.
And plenty of companies then watched that cash fly out the window, thanks to the pandemic and inflation.
Here’s what happened. Like so many others these days, the Calcbench research team was wondering whether the economy has been sliding toward recession or even already is in recession. So we assembled a group of more than 1,800 non-financial companies with at least $100 million in annual revenue; and then studied average cash flow from operations since 2019. See Figure 1, below.

OK, that’s not bad. It tells us that a broad swath of the economy is generating more cash from what that business actually does — not from financing or investing; from bread-and-butter operations. Even 2023 numbers, which only capture the first three quarters of last year, are trending in the right direction.
Next question: where is that money going? Is it being saved or invested? To answer that question, we looked at average cash and equivalents for that same group of companies. See Figure 2, below.

OK, no surprises here. Average cash holdings popped in 2020 as everyone stocked up on cash to endure the pandemic, and have been trending downward ever since. So companies are not saving these greater amounts of cash they’re generating.
Indeed, if you examine cash on a quarter-to-quarter basis (not shown here, but we did peek at those numbers) you’d see a vertiginous plunge in cash during the first half of 2022 as inflation surprised everyone and caused expenses to soar.
On the other hand, average cash across the three quarters of 2023 hovered around $850 million. In coming weeks, we might see that everyone had a great Q4 and cash for the whole year rose; we don’t yet know.
Of course, Figure 2 above doesn’t necessarily mean companies were spending down cash levels. In theory, they could have diverted that cash to investing or financing activities, which could also explain lower cash levels on the balance sheet.
To clarify that picture, then, we also examined average operating expenses across the same not quite five-year period. See Figure 3, below.

Notice the jump upward in 2022. It’s a clear indicator that even as companies were generating more cash from operations (good), that extra cash went right into higher operating expenses.
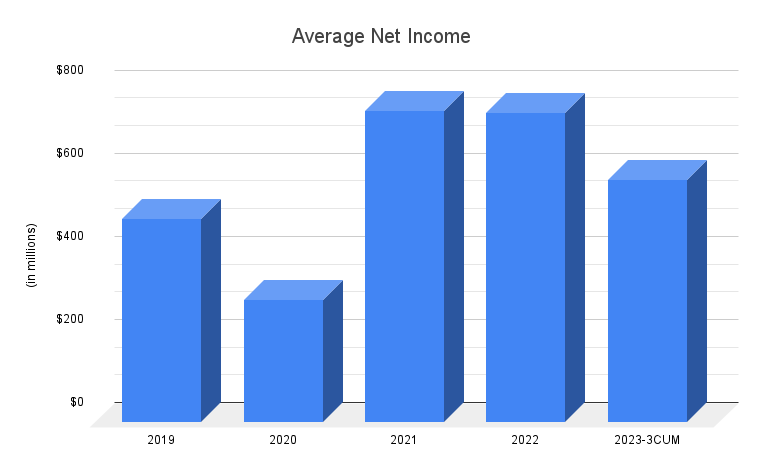
Is all hope lost? Well, let’s check the bottom line. Figure 4, below, shows average net income for our sample group.

Clearly net income rose sharply in 2021, but that’s more a recovery in net income from the low, pandemic-induced floor established in 2020. Once the economy stabilized at the end of 2021, however, average net income didn’t really improve from 2021 to 2022 — and we’d need to have a gangbusters Q4 for 2023 average net income to sail past 2022.
What does all this mean for the future? Calcbench doesn’t know. We’re encouraged by all these numbers moving in good directions in latter 2023, which supports the broader story these days that the economy is healthy overall. Still, there’s lots to wonder about when you dig deeper into the data.
Thankfully, data is what Calcbench has in spades. Whether you want to conduct your own macro-economic analysis or build more detailed models for specific industries, you can use our Bulk Data Query page and other databases to test as many questions as you’d like.