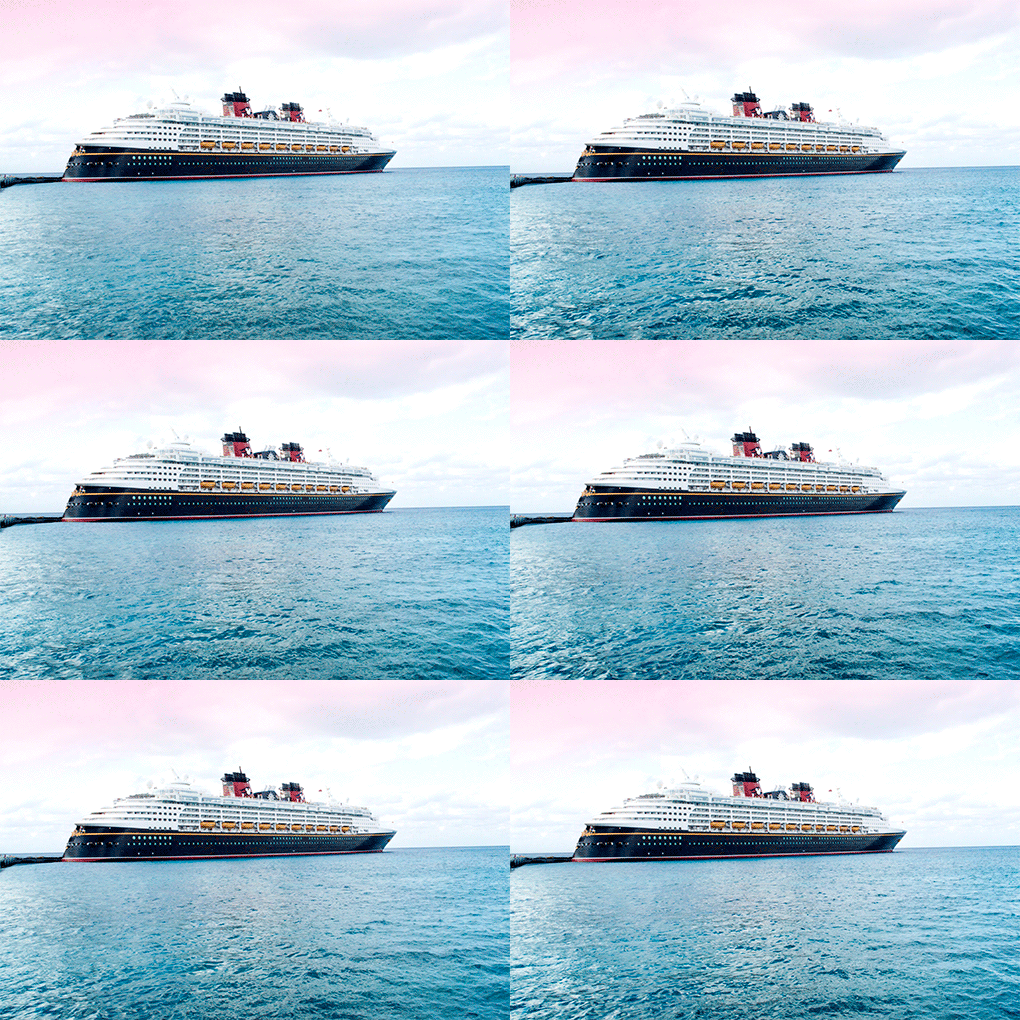
Lots of financial analysts and other Calcbench users might be wishing they could sail away on a tropical cruise as we enter the holiday slow season, so perhaps it’s a good time to visit Carnival Corp. ($CCL) and the company’s latest financial performance.
Carnival filed its latest quarterly (and fiscal year-end) earnings release on Thursday, and top-line numbers looked pretty good for a company still recovering from the pandemic’s apocalyptic effects four years ago. Quarterly revenue jumped 40.6 percent from the year-ago period, to $5.4 billion; annual revenue soared 77.5 percent to $21.6 billion.
But wait, we have even more revenue detail! Thanks to several nifty GAAP and non-GAAP disclosures that Carnival makes, we can also determine whether cruise passengers are paying more per ticket and spending more once they’re onboard.
Let’s first look at the revenue disclosures. Tucked away in the earnings release is a breakdown of where that $5.4 billion revenue number comes from. See Figure 1, below.

Further down, Carnival also discloses several non-GAAP metrics under the heading “Statistical Information”— including the number of passengers carried. See Figure 2, below.

Note that last item, passengers carried. So if we use Calcbench’s Nobel-prize winning “Show tag history” feature, which lets us see previous disclosures for the same line item, we can divide the number of passengers into passenger ticket revenue, and calculate ticket revenue per passenger.
Calcbench did exactly that, starting from first-quarter 2021 through this latest quarter, ending Nov. 30. The results are in Figure 3, below.

For those who don’t want to squint at the blue line, ticket revenue per passenger went from $600 in Q1 2021 ($3 million in revenue from 5,000 passengers) to $1,132 at the end of 2023 ($3.51 billion in revenue from 3.1 million passengers).
There’s also that “Onboard and Other” revenue segment, which was $1.9 billion for the most recent quarter. We’re not entirely sure what goes into that line item. Carnival doesn’t say, either in the earnings release or the more fulsome Management Discussion & Analysis disclosures made in the 10-Q. Clearly some of that revenue comes from passenger spending onboard the ships; the “other” category likely includes travel insurance or other ancillary products Carnival sells to passengers even when they’re on dry land.
To make matters even more interesting, Carnival had more onboard-and-other revenue than passenger ticket revenue in the beginning of 2021, so average onboard-and-other revenue per passenger was sky-high in that period — and then plunged as more passengers returned to the high seas, pushing average spend down.
We charted the numbers out anyway, dropping the first two quarters of 2021 since they skewed the curve for the rest of the data. See Figure 4, below.

Overall, Carnival seems to have weathered the pandemic storm and is now sailing toward brighter shores. And for financial analysts, it’s yet another example of how you can dig up a treasure trove of insight from the earnings release and Calcbench database powers!
