Summary: SEC comment letters are not immediately released to the public, but a study of long-term trends shows that the delay in disclosure of those letters has fallen dramatically.
In our previous post we examined the number of comment letters the SEC sent companies in 2020 and 2021, as well as how many replies companies sent back. An interesting point is that comment letters sent to or from the SEC do not immediately become public. Rather, there is a delay of at least 20 business days (per SEC rules), and sometimes the delay is longer.
So what is the average delay in publication of comment letters? Calcbench decided to investigate.
When one searches the EDGAR database of SEC filings, you can find SEC comment letters to a company and all the ensuing correspondence — but you can only find when the letters were filed, not when the letters became public. Fear not, however! Calcbench has you covered.
Calcbench our database notes when comment letters are released by the SEC, and records both the date in which the letters were filed and the date those letters were released. The delay between when a letter is filed and when it was released is interesting.
We examine the trend in the average delay between when a letter is filed to when it is released to the public over the last 10 years. As you can see in Figure 1, below, that delay has declined markedly — from roughly 140 days in 2011 to only 60 days in 2021. (Keep in mind that some comment letters filed in later years have not yet become public, which will increase the delay, but the trend seems to be very telling.)

We can also see that the delay in releasing SEC comment letters is slightly higher than the delay in releasing companies’ correspondence.
Are these patterns true for both large and small companies? We decided to answer that too, so we ran the same analysis for S&P 500 companies specifically.
As you can see from Figure 2, below, the same meaningful decline holds true for large companies. When comparing the delays, we note that the average delay is actually shorter for the S&P 500 than it is for all companies. The average delay we observe for large firms in 2021 is roughly 40 days, compared to 60 we saw for all companies.

Many factors can affect the delay in the SEC releasing the letters to the public, such as:
- The time it took the SEC to complete its review;
- The time it took the company to respond to the SEC;
- The complexity of the topic reviewed;
- The efficiency in the review or the resources spent on it.
Our analysis doesn’t examine the reasons for the factors that affect the delay, but for those of you interested, Calcbench has the data. Visit Calcbench’s filings page to see when filings are files and released. If you want to search the comment letters, you can do that in the disclosures page.
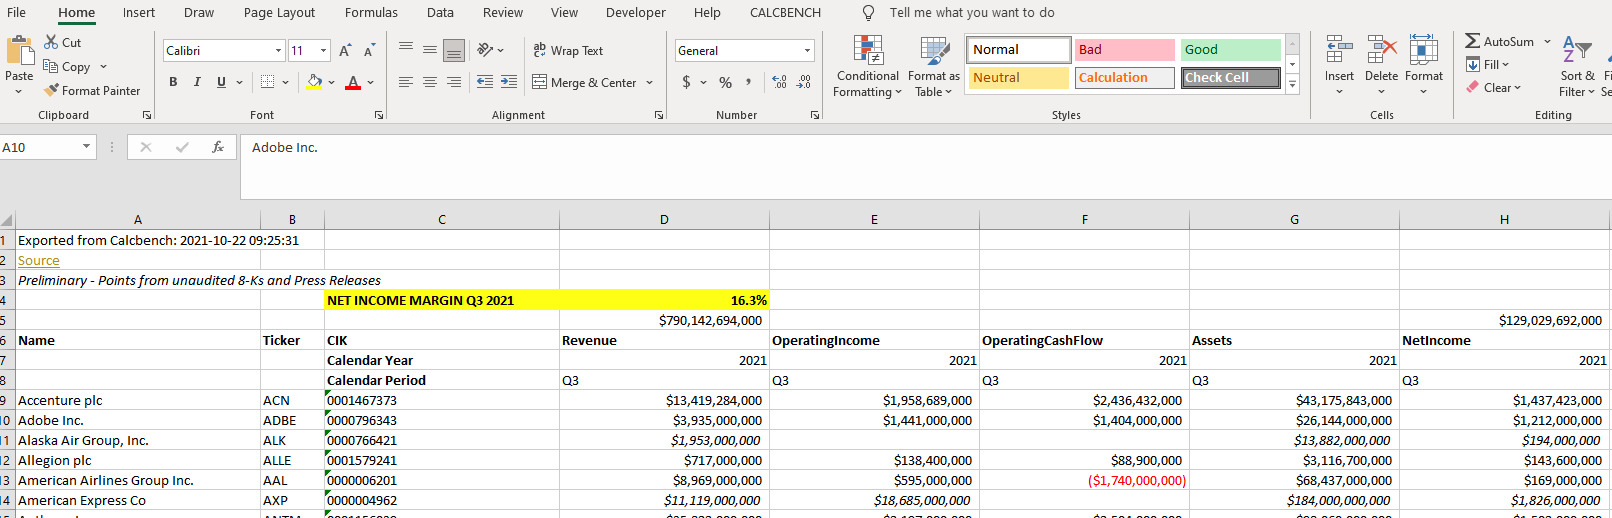
What can you do? Here’s what you can do. Calculate a Net Income margin in real time. This morning, Friday October 22, 2021 at 9:25 EDT, we retrieved all S&P500 firms that had reported this period. There are 103 firms in our sample as of that time.
Net Income for those firms was 129 Billion. Revenue was 790 Billion for a margin of 16.3%
Last year for those same firms, the number are 75.8 B Non Net Income and 698B in revenues for a margin of 10.9%.
Get the Excel Add in and have a go yourself!
Thanks!
Another day, another nifty time-saving feature we are happy to offer Calcbench subscribers. This time around it’s an ability to export earnings release data directly to Excel, almost immediately after said earnings release hits the wires.
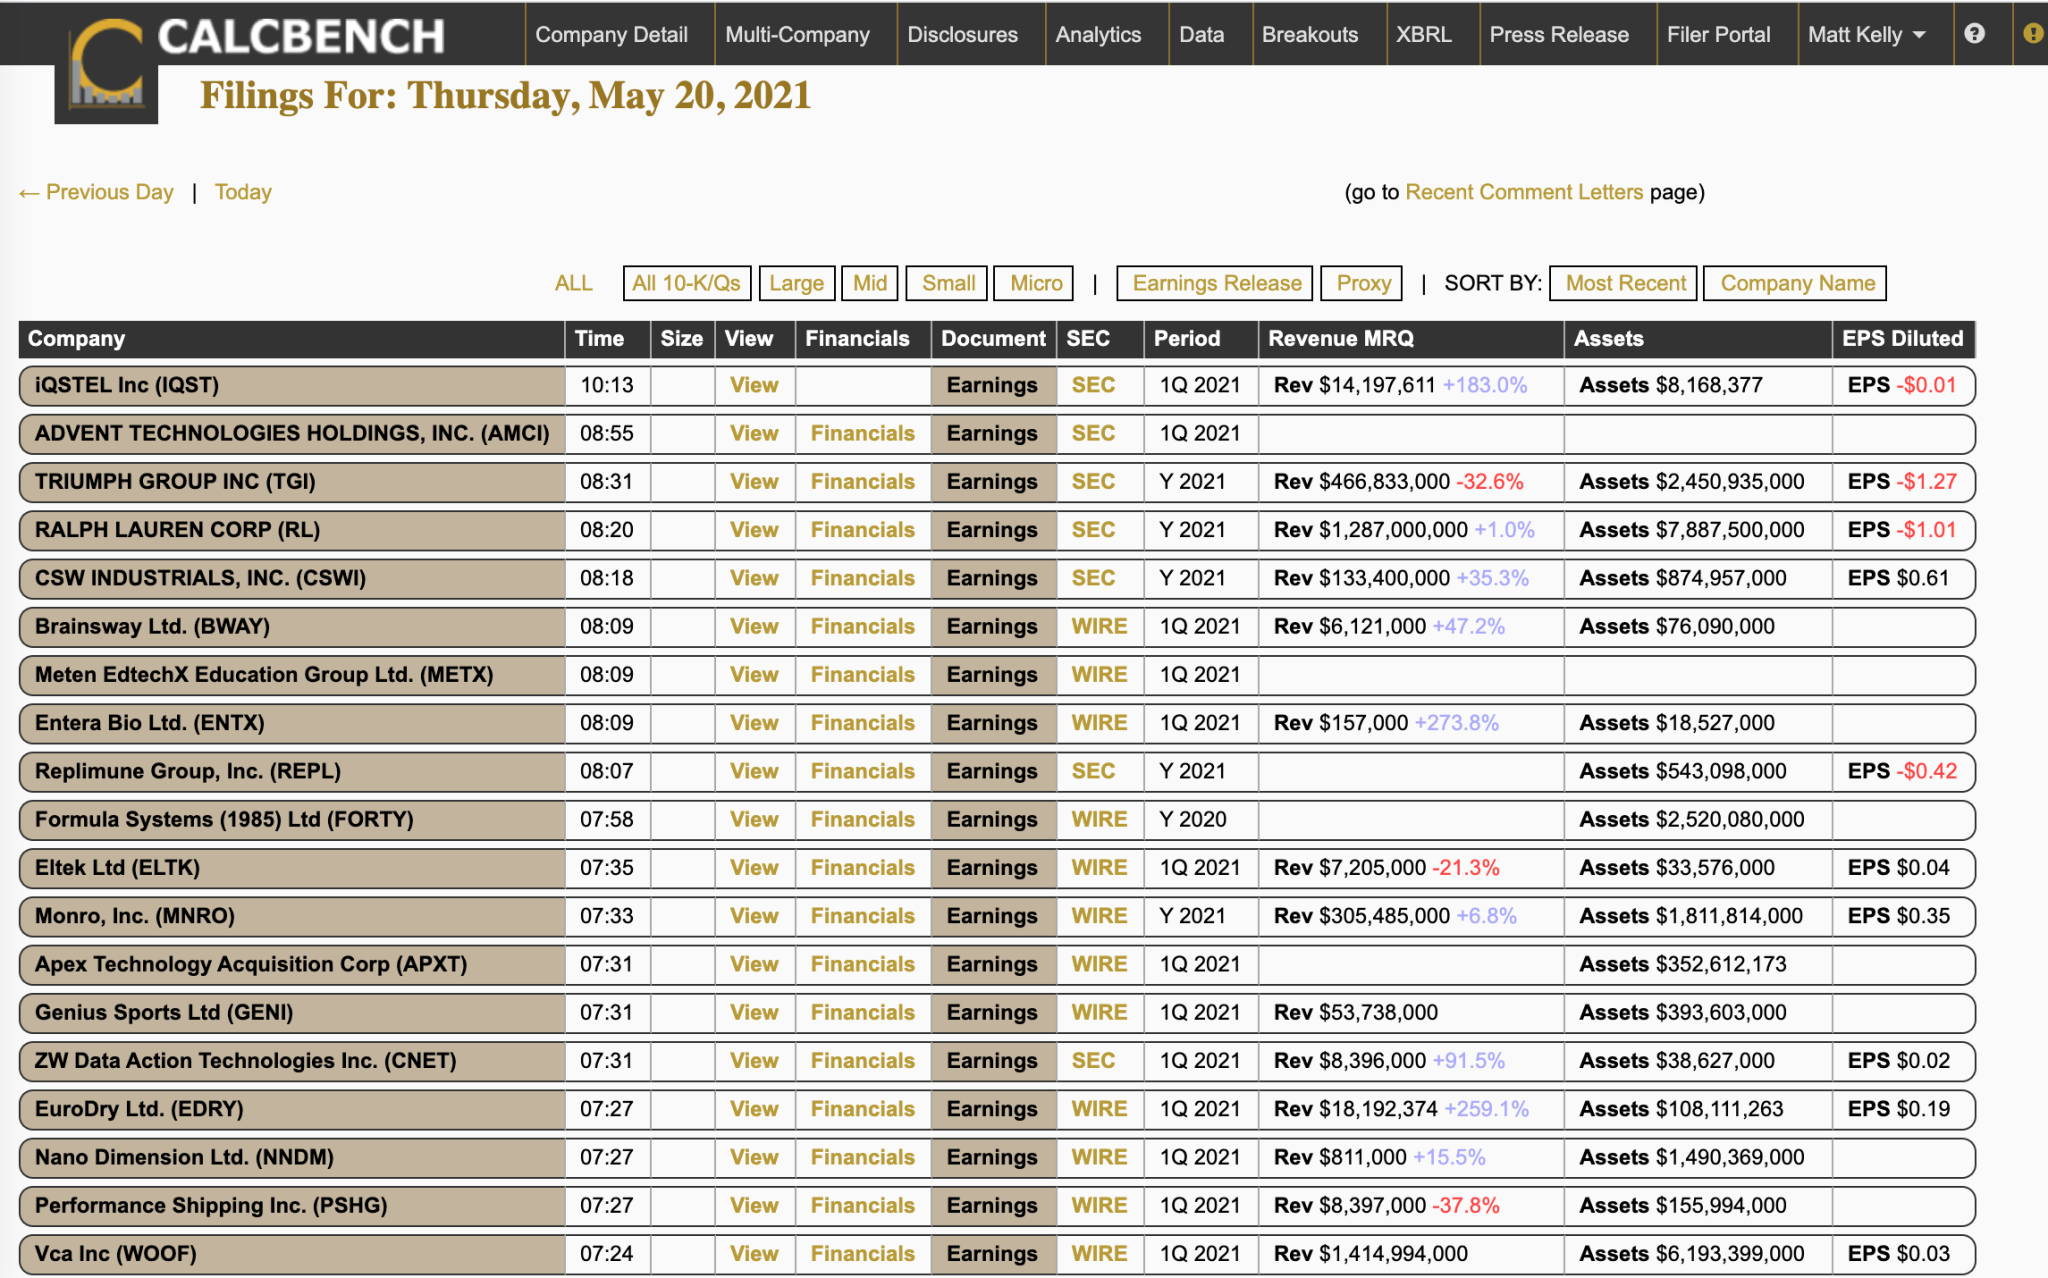
Here’s how it works. Start at our always-popular Recent Filings page. This is where Calcbench presents the latest filings from public firms, which we capture and prep typically within a few minutes of those firms filing their disclosures to the Securities and Exchange Commission. See Figure 1, below.
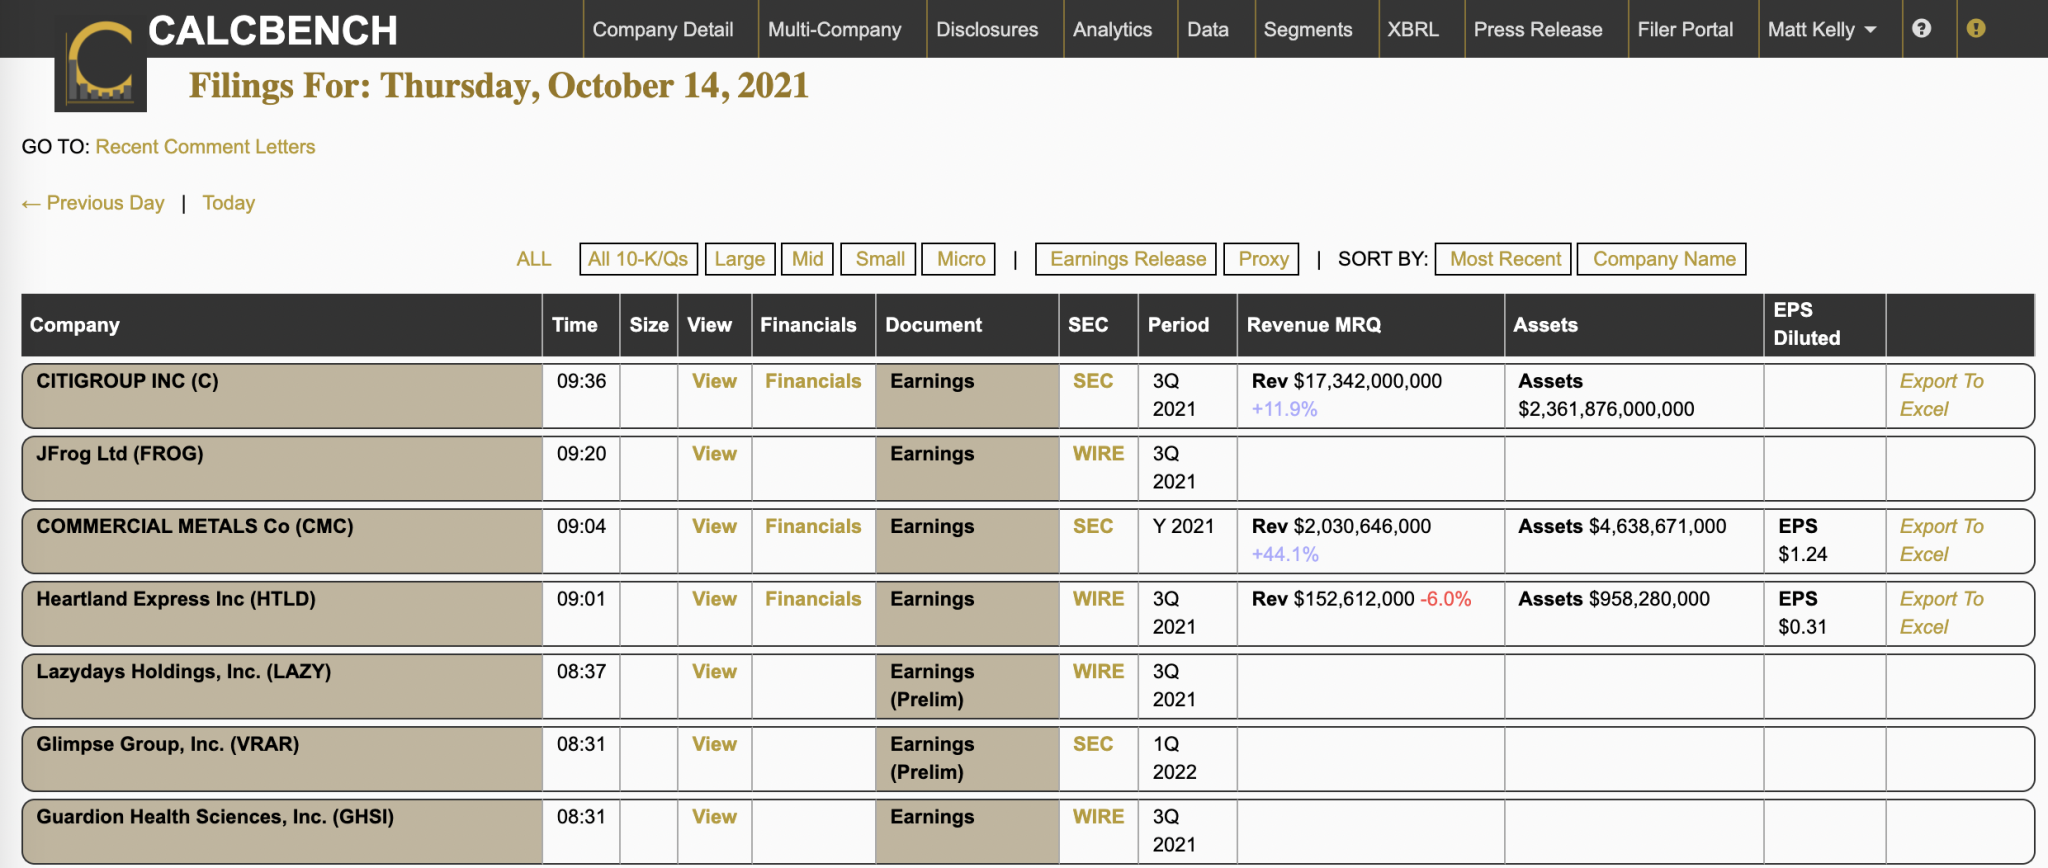
Notice that column on the right-hand side that says “Export to Excel” in numerous places. Behind the scenes, Calcbench has indexed the data in those filings so that they can be, you guessed it, exported directly to Excel.
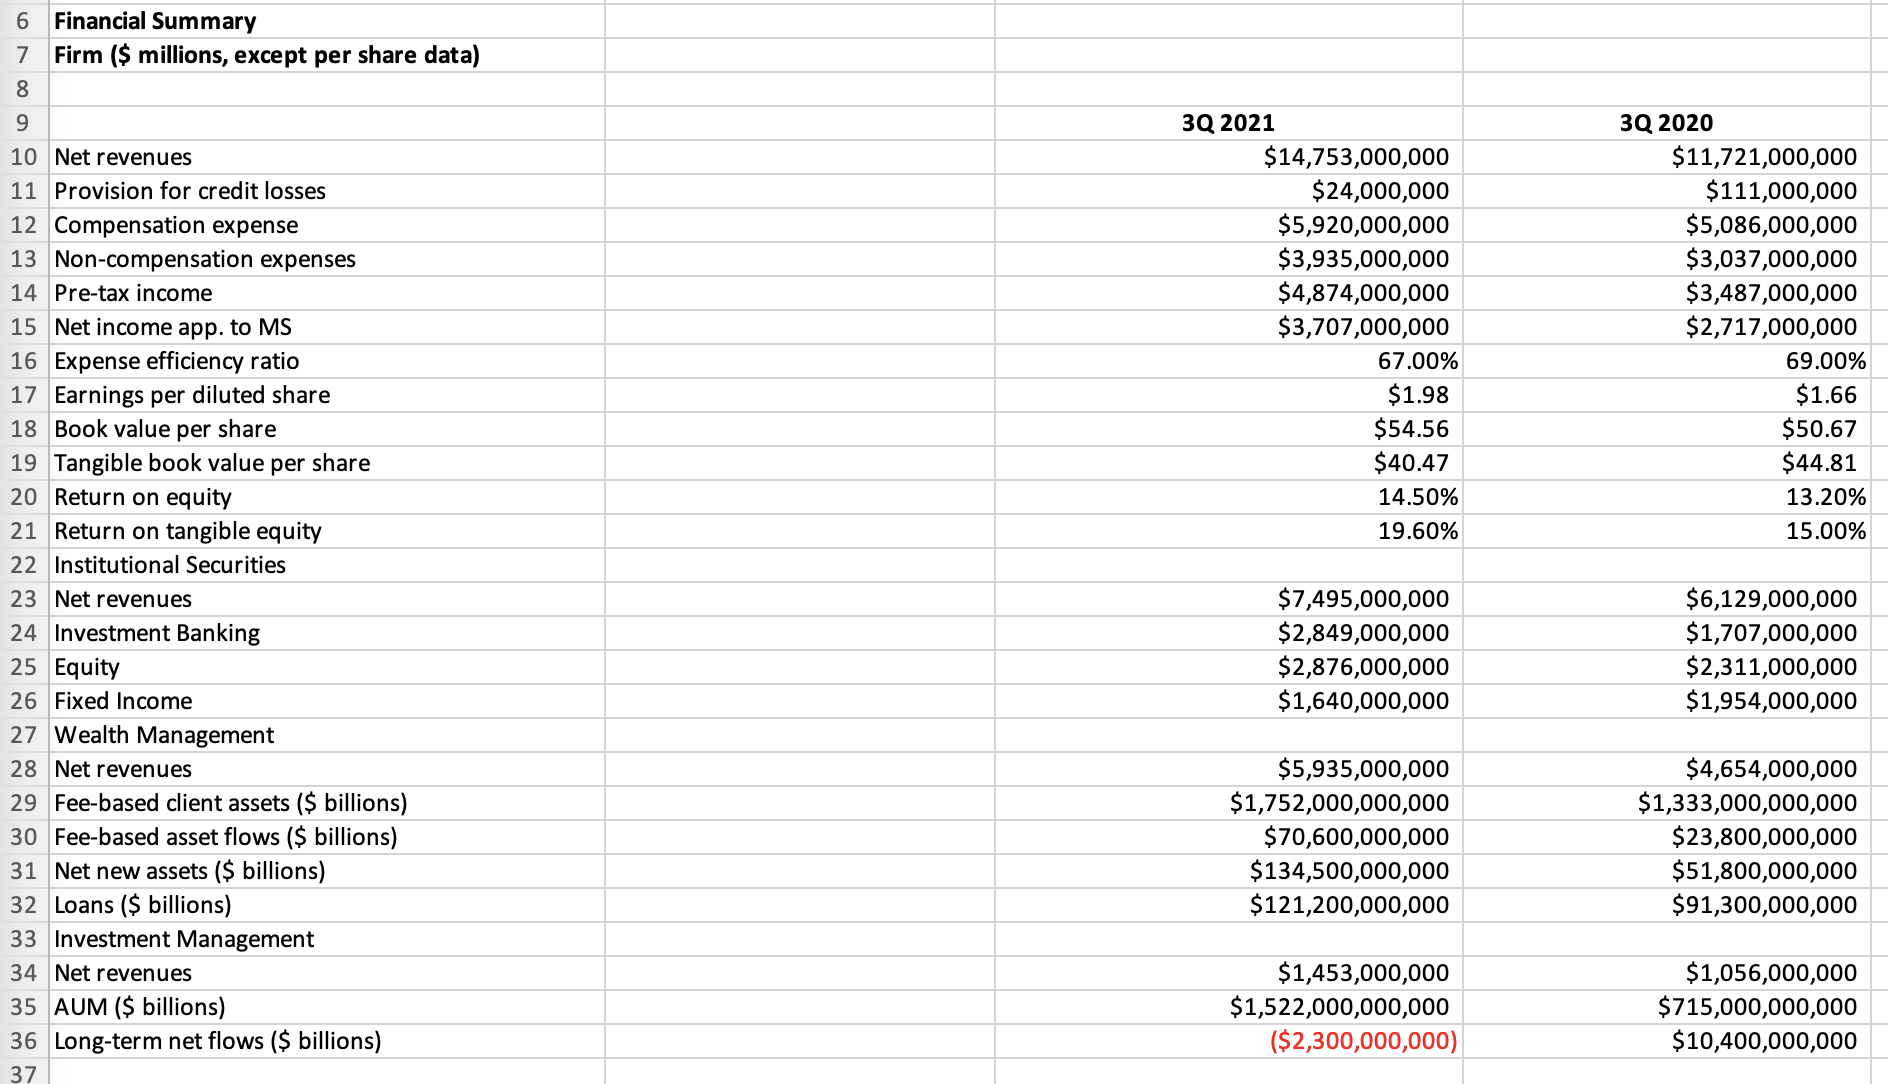
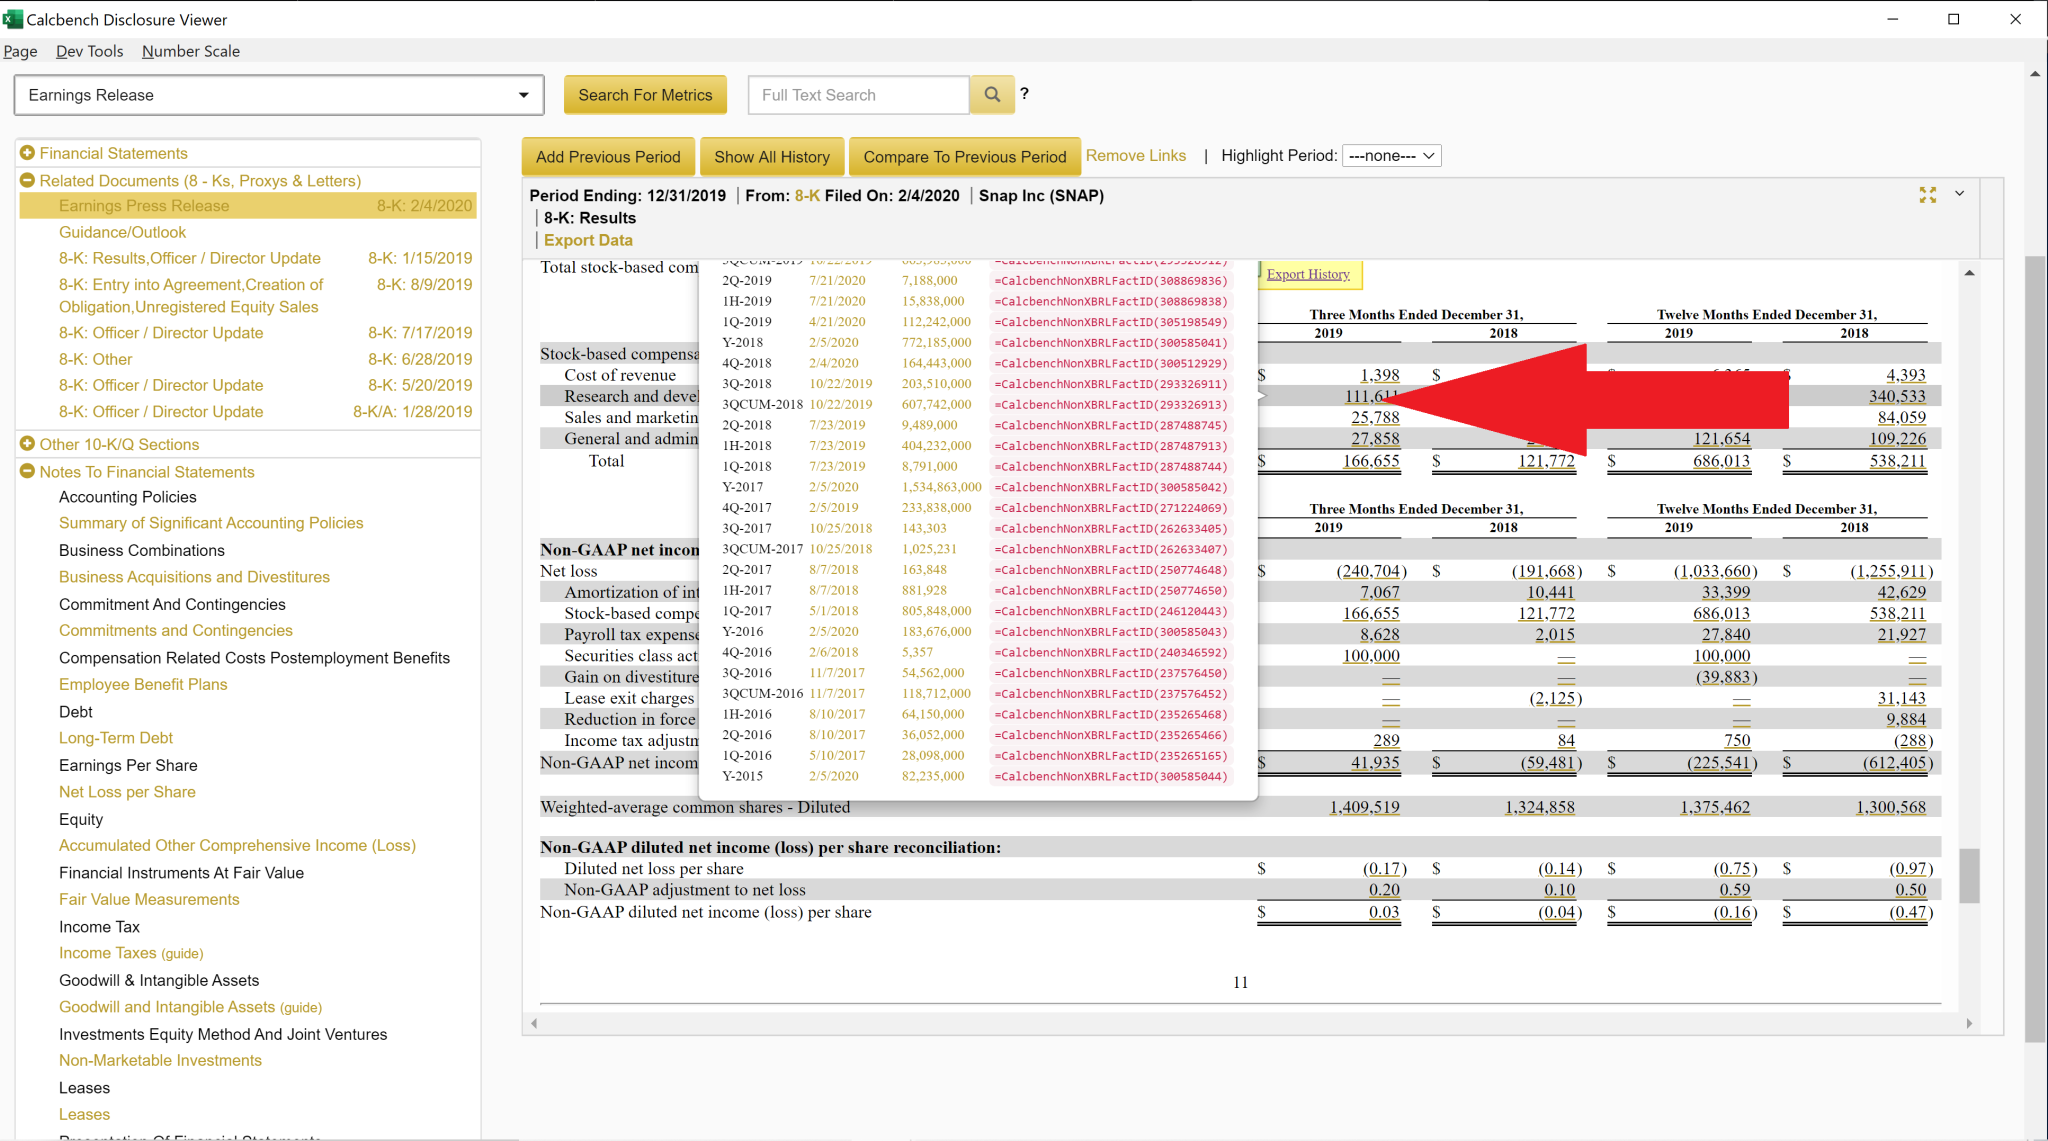
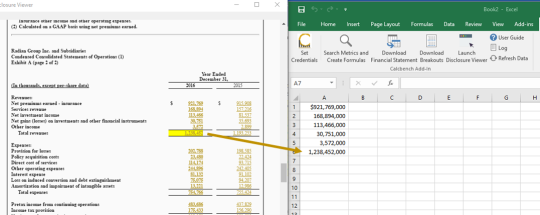
When you click on that option, an Excel file will download onto your computer that you can open, read, and start using. For example, we downloaded the Citigroup ($C) third-quarter earnings release filed this morning, and immediately saw this, Figure 2.
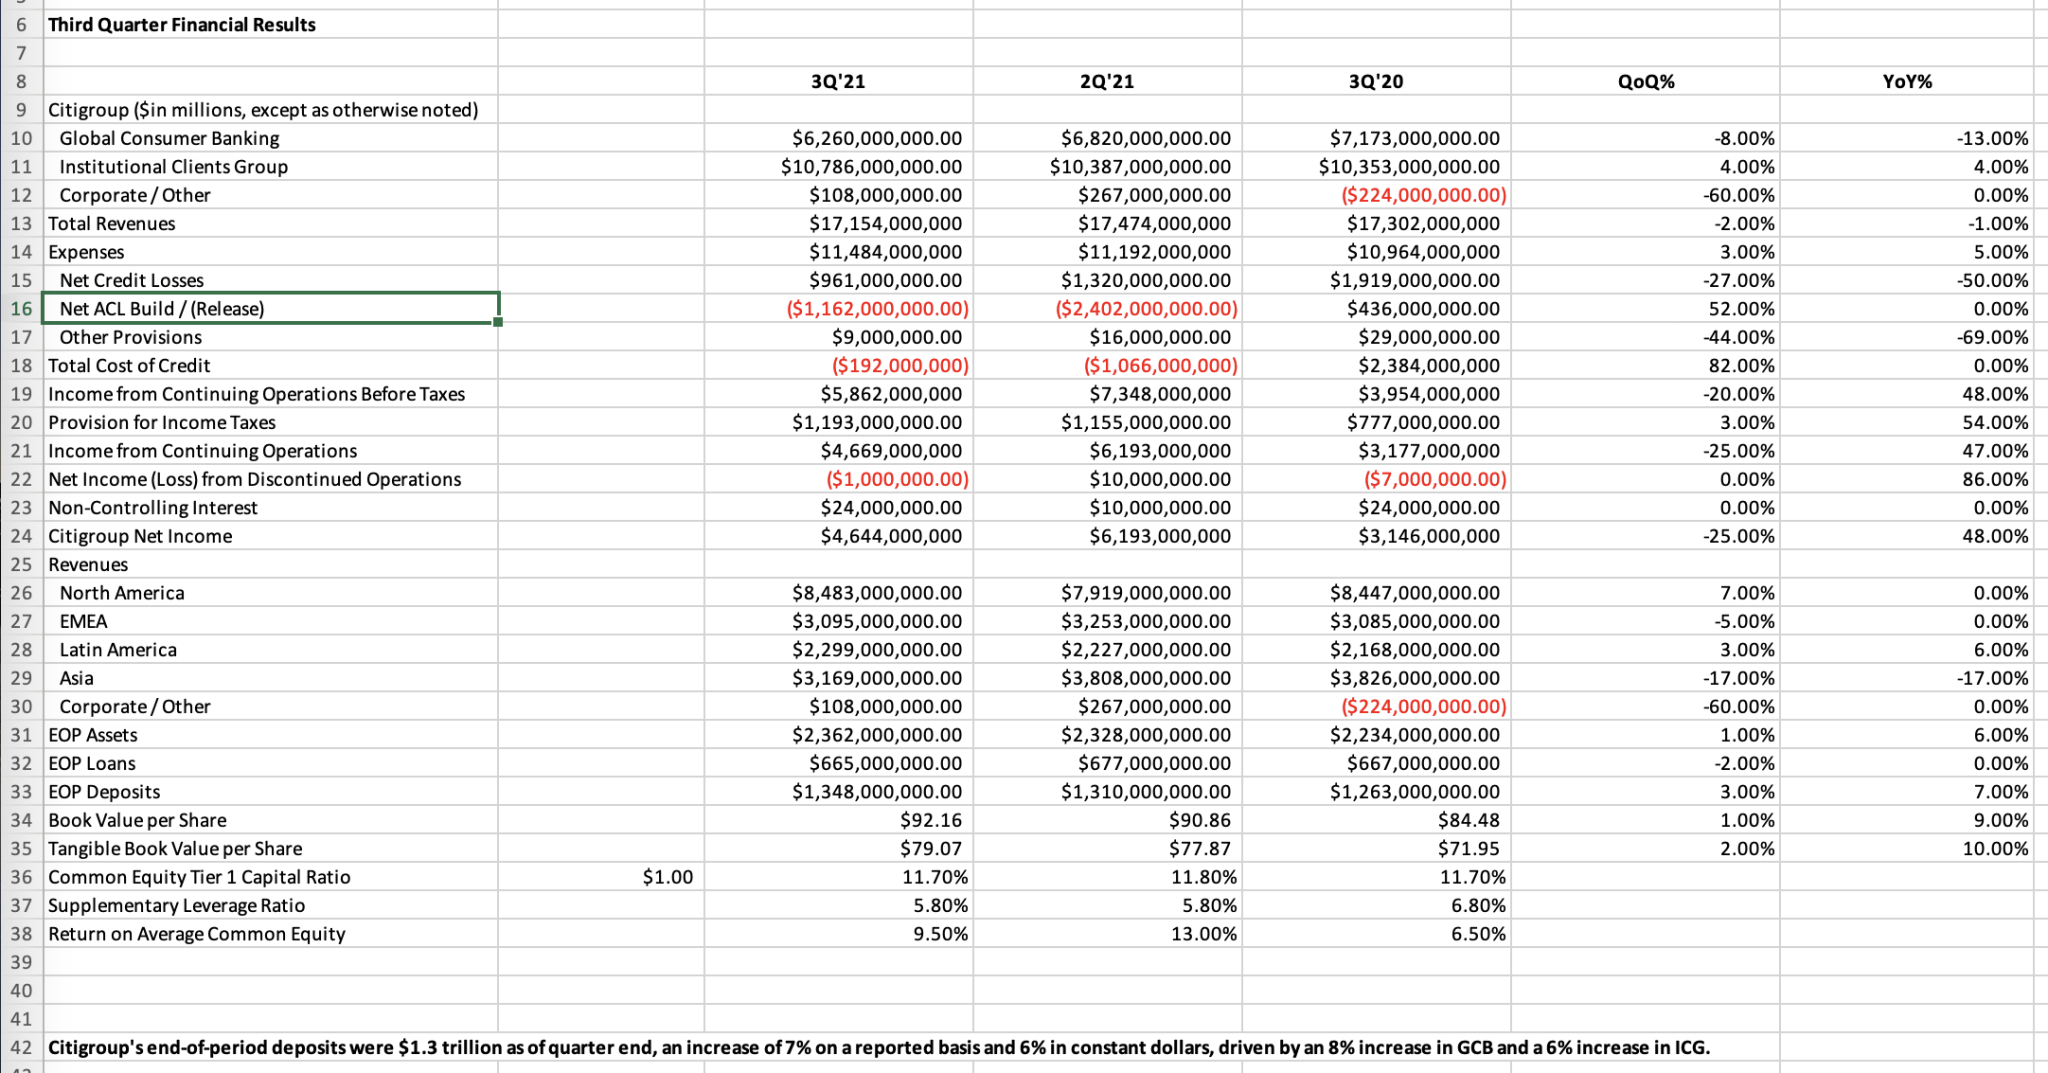
The spreadsheet shows the financial results Citi presented in its earnings release: 3Q 2021, plus the prior quarter, plus the year-ago quarter. You can even see quarter-over-quarter and year-over-year change!
Figure 2 is just one example of what you’d see from Citigroup; there’s a lot more in the Excel spreadsheet that we haven’t shown. Our Export to Excel feature can capture just about any table with tagged data that a company includes in its earnings release, from a summary of financial performance, to full income statement or balance sheet, and even reconciliation statements.
The flip side is that if a firm doesn’t file lots of information in its earnings release, the Excel spreadsheet will be smaller. For example, we also have this Q3 summary from Morgan Stanley ($MS), also filed today, in Figure 3, below.
Morgan Stanley only offered 3Q 2021 and 3Q 2020 data in its release, so that’s all we can pull. If you want 2Q 2021 or other periods, you gotta wait for Morgan Stanley to file its full 10-Q report in a few weeks.
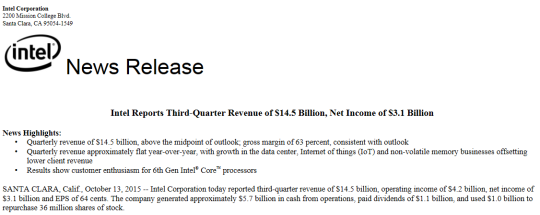
We should also add that our new exporting capability works for some earnings releases, but not all. Some firms will structure their releases in quirky ways that leave the data beyond indexing. Tesla ($TSLA), for example, is a party-pooper that files its earnings release as a JPEG image. Humans can read that, but algorithms can’t — so you won’t be able to do this nifty stuff with Tesla. (If you look back to Figure 1, you can see a few other firms where Export to Excel isn’t available either. Most of the S&P 500 will be, but it’s not universal.)
You can, however, still read filings from Tesla or any other errant firm in our usual Interactive Disclosures database, and export the data to Excel from there. It’s one extra step, but you do end up in the same place. For more information on earnings press releases, check out our how-to video.
Calcbench now has standardized face financial data from earnings press releases minutes after they are published. This will be useful for quantitative asset managers who want to include fundamental signals in their model.
Calcbench is extracting the metrics from the income statement, balance sheet, and statement of cash flows. This includes market moving revenue and earnings per share numbers. Quality is improved by Calcbench’s ten years of experience parsing the XBRL 10-K/Qs.
We listen for the news wires and earnings announcements filed as 8-Ks on the SEC’s Edgar sight. The Calcbench extraction process is entirely automated so you have numbers minutes after they are published.
For back-testing purposes we have about 10 years of history with time-stamps of when the data was available. Coverage is almost all US public companies.
A sample for the 30 companies in the DOW is @ https://www.dropbox.com/s/vazfcnlbhhqyh2n/blog_data.csv?dl=0. An example of a script to get the data is @ https://github.com/calcbench/notebooks/tree/master/filing_listener. For a larger sample and to discuss integrating the data into your process email
Another quarter, another expansion of Calcbench’s awesome financial data superpowers. This time around, we’re here to tout updates to our earnings press release tools.
The news is this: that Calcbench Professional users can now access all numbers in the text and tables of firms’ earnings releases, within minutes of said press releases hitting the wires. In a recent study we conducted of more than 13,000 press releases, our users had access to data within press releases in an average of five minutes.
Those enhancements enable financial analysts and money managers to make more informed decisions, using Calcbench’s model-ready data. As with all Calcbench data, earnings press release data is available to export from our website, or can be directly accessed through Excel, Google or the Calcbench API. (You can also see earnings releases on our Recent Filings page. It will look like Figure 1, below.)
One recent example is Iron Mountain ($IRM), an enterprise information management company. On May 6, prior to 7:00 a.m. ET, Iron Mountain released its earnings press release. By the time the market opened, Iron Mountain’s stock price gained $0.78. By the closing bell, Iron Mountain’s price increased another $2.14. Analysts who had systemic access to the press release data would have had their models primed to take advantage of those price moves.
“Information moves markets. Calcbench understands that the more efficiently analysts can populate their models, the faster they can act on the new information.” said co-founder and CEO of Calcbench. Pranav Ghai. “That’s why immediate access to data embedded in earnings press releases, such as GAAP, non-GAAP, key performance indicators and segments, is critical.”
We agree, and not just because Ghai is our boss. The point is valid no matter who says it — and because it’s valid, that’s why we’ve developed that access to the data for our users.
By the way, Calcbench continuously upgrades its functionality based on user feedback. We previously announced the ability to compare side-by-side comparisons of preliminary income statements against previously reported numbers, without the hassle of manually inputting the data.
What will we do next? Stick around and find out.
Every now and then Calcbench reviews the time that elapses between a firm publishing its earnings release and the subsequent filing of its 10-K or 10-Q. We started this analysis back in 2016, then followed up with another look 2018, and yet another in 2020.
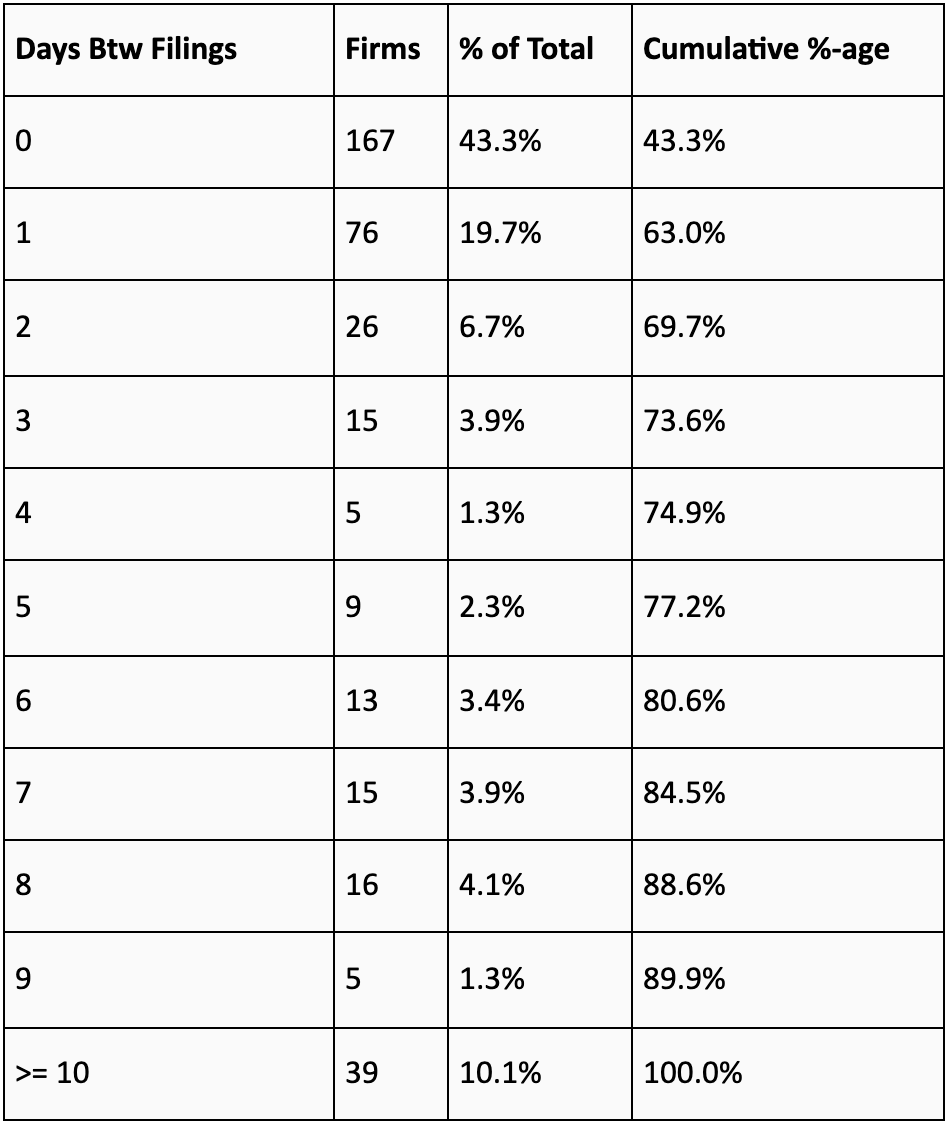
Now we have some fresh numbers for 2021. We looked at the most recent 10-Q filing period for 386 firms in the S&P 500; a table of our findings is below. As you can see, 63 percent of the firms in our sample filed both documents within a day of each other, and more than 40 percent filed both documents on the same day.
Still, 10.1 percent of our sample took 10 days or more after filing the earnings release to follow up with the 10-Q. This time lag makes earnings release data more important, since you can act on it quickly rather than wait for the 10-Q to be filed.
Unlike when we started tracking this data in 2016, today Calcbench collects all data in 8-K filings and provides that data to our clients so they can populate their models. So if you want to learn more, drop us an email or use the chat function on Calcbench.
Good news for all you data fanatics, eager to export yet more corporate disclosures into Excel so you can perform whatever analysis you’re hoping to do: Calcbench has added new capability to let you pull data from earnings releases.
Here’s how it works.
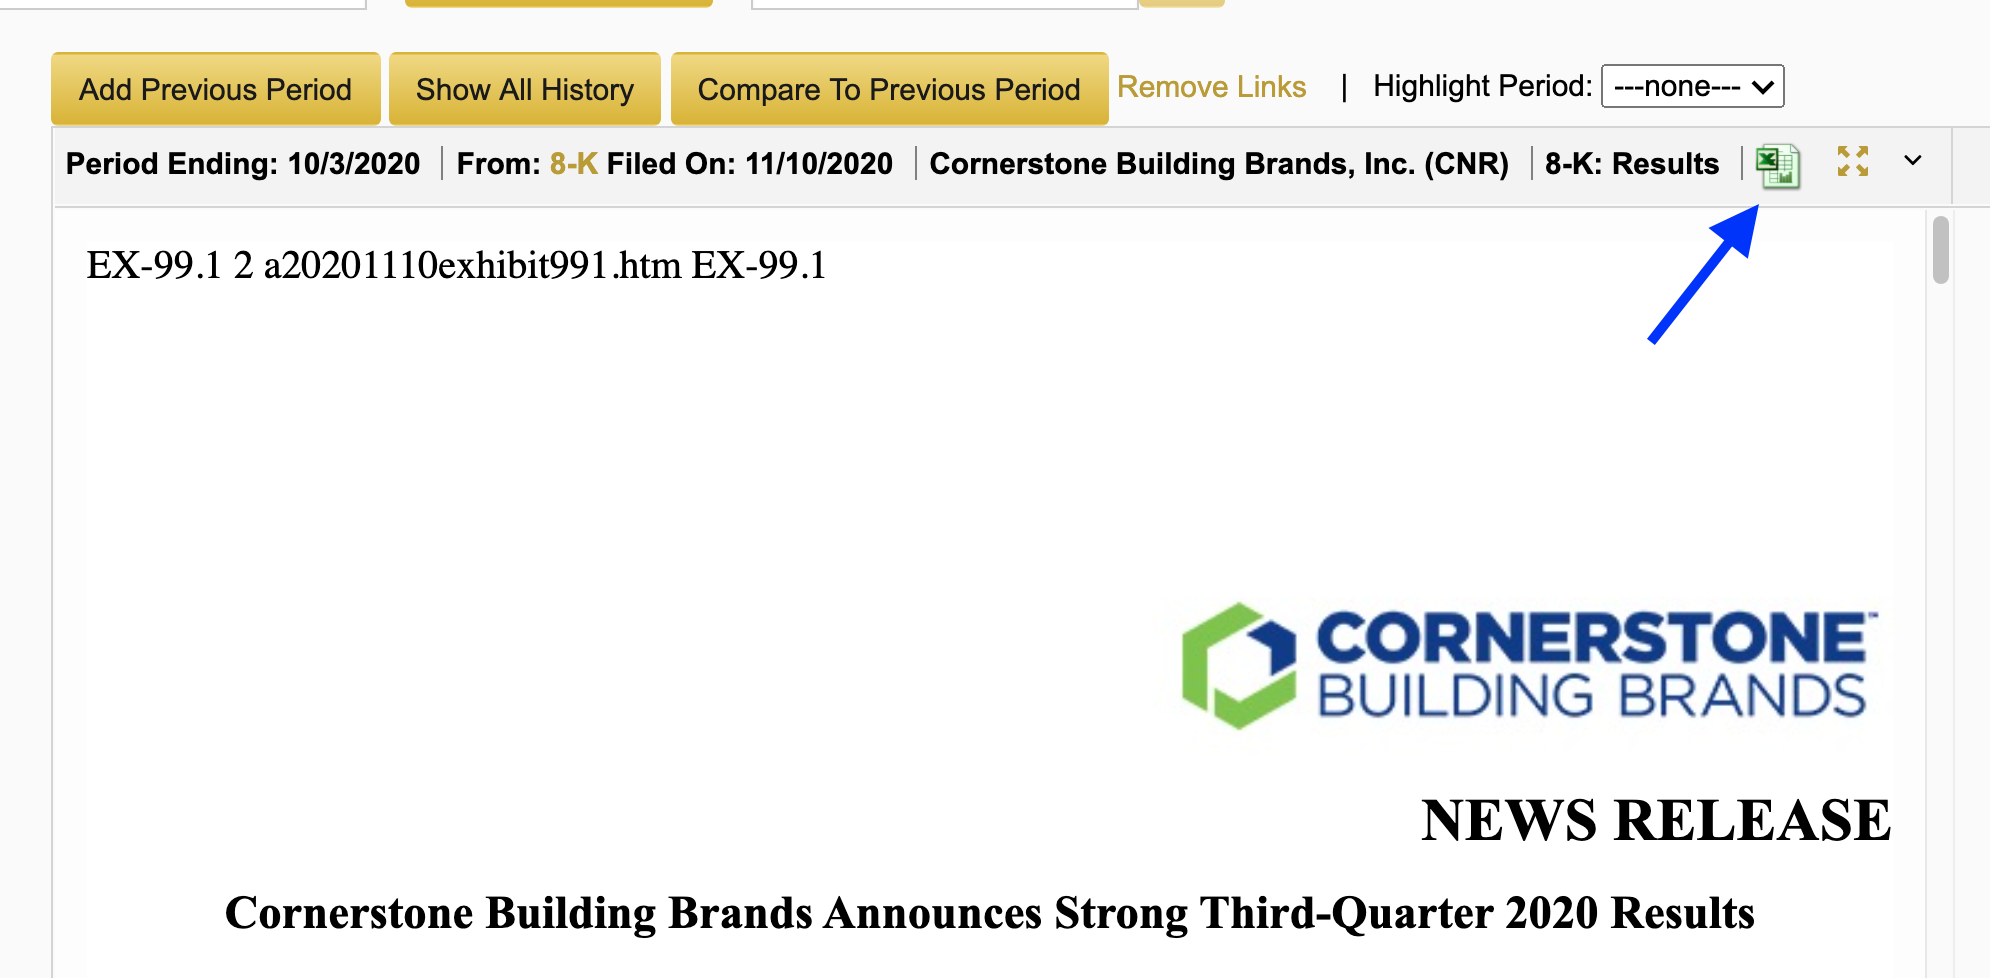
First, you need an earnings release. Perhaps you have one because you’ve set up your Calcbench email alerting functions and been notified that one of your favorite firms just filed an 8-K earnings release; or maybe you were skimming our Recent Filings page and a firm’s release caught your eye. We randomly selected Cornerstone Building Brands ($CNR), which filed its latest earnings release on Nov. 10.
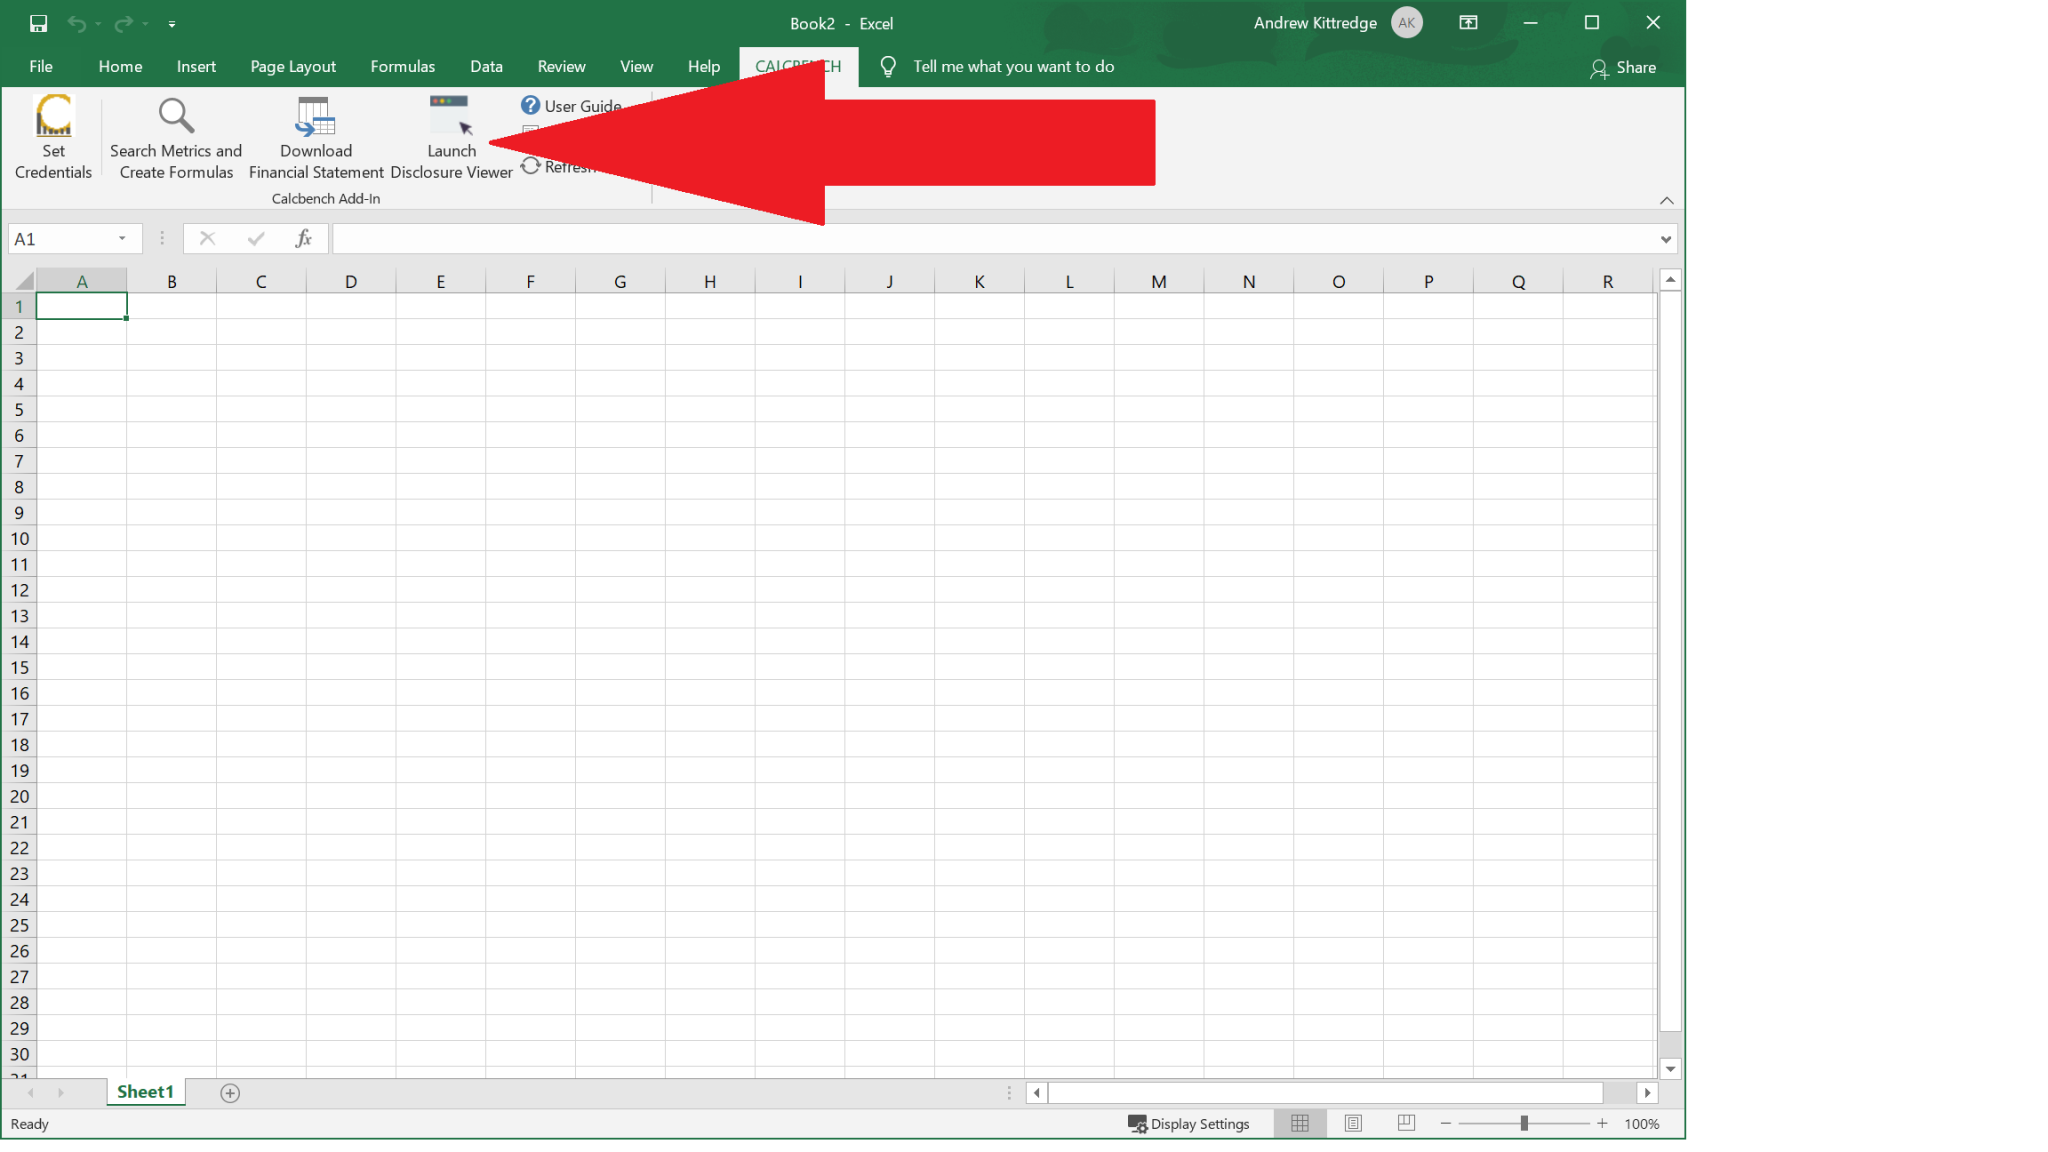
Anyway, you have the earnings release displayed on your screen. What then? Look for the small Excel icon along the top of the main display panel, next to the firm’s ticker and the ‘8-K: Results’ descriptor. See Fig. 1, below; we’ve pointed to the icon with a blue arrow.
When you click on that icon, an Excel spreadsheet will download with all the earnings release data organized into neat rows and columns. It will look something like Figure 2, below:
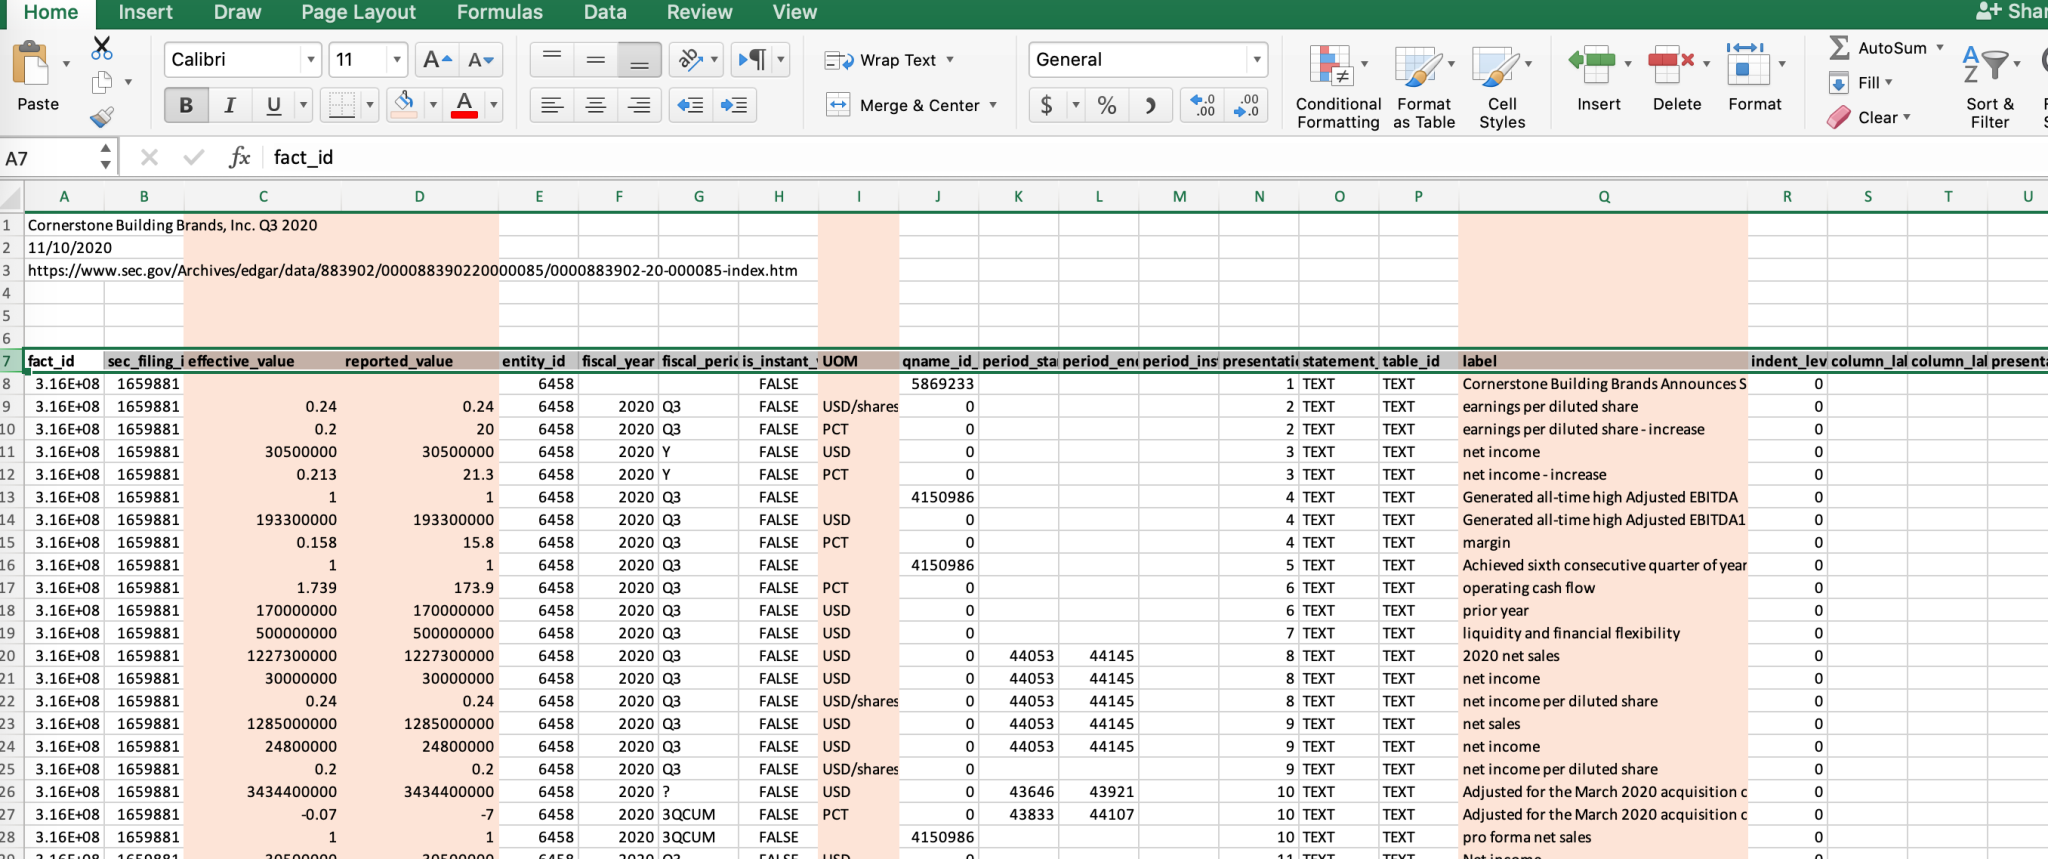
There’s a lot going on in that spreadsheet, so let us explain. Some of the columns track details that might not be urgent to financial analysts, such as tag identifiers or Securities and Exchange Commission filing codes. In Figure 2, we shaded in orange the columns that are most important to financial analysts. Those columns won’t be shaded in your own download, but some examples include:
- Effective value, which is the data expressed as an actual numeric value. For example, something that might display as 21.3 percent to us humans has an effective data value of 0.213.
- Reported value, which is that number gussied up for human consumption: 21.3, since in the filing it will be reported as a percent.
- UOM, which stands for “unit of measurement.” You might see “USD” for dollars, “PCT” for percentage, and so forth.
- Label, which is what the disclosure represents: net income, increase in net income, pro forma net sales, and so forth.
Once you have that data in Excel — well, what you do with it next is your choice. Calcbench simply strives to provide all the data you want, in a manner that lets you use the data however you want. This is one more step toward our goal. Enjoy!
Calcbench friends. We heard you. In response to client and prospect requests to see all the data in press releases, we’ve launched improvements to our tools.
Now you can:
-Grab bulk data from the press releases -Access time series press release data -Save time (get every single line item within the press release with a mouse click)
Here's a quick 'How To’ for retrieving non-GAAP data using the Excel Add In
Calcbench continues to evolve its platform. Look forward to programmatic access to the full press release.
Your feedback is always welcome. Email us@calcbench.com for suggestions to improve our platform.
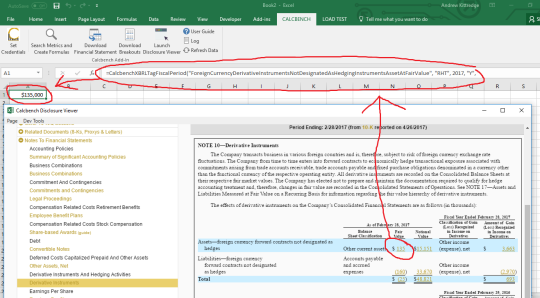
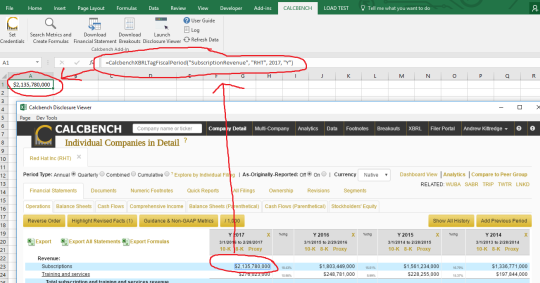
Calcbench makes it easier for analysts to extract numbers from earnings press-releases. In this post we will focus on the Non-GAAP numbers, those numbers not in the income statement, balance sheet and statement of cash flows.
As an example we will get non-cash compensation expense allocated to research and development for software companies, i.e. stock options awarded to software engineers. This example assumes, that you have a Calcbench account, sign up for a free trial @ calcbench.com/join and have installed the Windows version of the Excel Add-in from calcbench.com/excel.
1. Open the Disclosure Viewer
2. Find the relevant Earnings Press Release in the Disclosure Viewer
3. Click on the piece of data you want. This will insert the formula for the fact
4. Parameterize the period arguments to the inserted formula

5. Add more periods and drag the parameterized formula over.

Non-cash compensation for the software industry is collected @ https://www.dropbox.com/s/8dtcoiea7conkvs/r%26d%20stock%20based%20compensation.xlsx?dl=0.
This blog will outline the importance of and the steps to getting data out of the press releases that Calcbench has been collecting for the past two years.
Corporate press releases are released ahead of the quarterly earnings call that the company has with analysts and investors. The press release has information that won’t necessarily get into the 10-Q / 10-K. For those reasons, it becomes important for users to get this data.
Historically, users only had access to this data by manually collecting the releases and then inserting data (hand keying information) into their spreadsheets/databases.
Today, that has changed.
Using Calcbench, a client can get this data in a few different ways. First, they can simply view it online. They can collect data from the web by exporting it. Or, they can bypass the web and access this data DIRECTLY through our Excel Add In or the Calcbench API.
See below from the income statement section of Paychex 8-K that came in on the morning of October 6, 2020. Also, note that this information collection process pertains not only to the Income statement but also to the Balance Sheet and the Cash Flow statement. Calcbench also captures tables of data as well, including GAAP to NON-GAAP reconciliation tables.
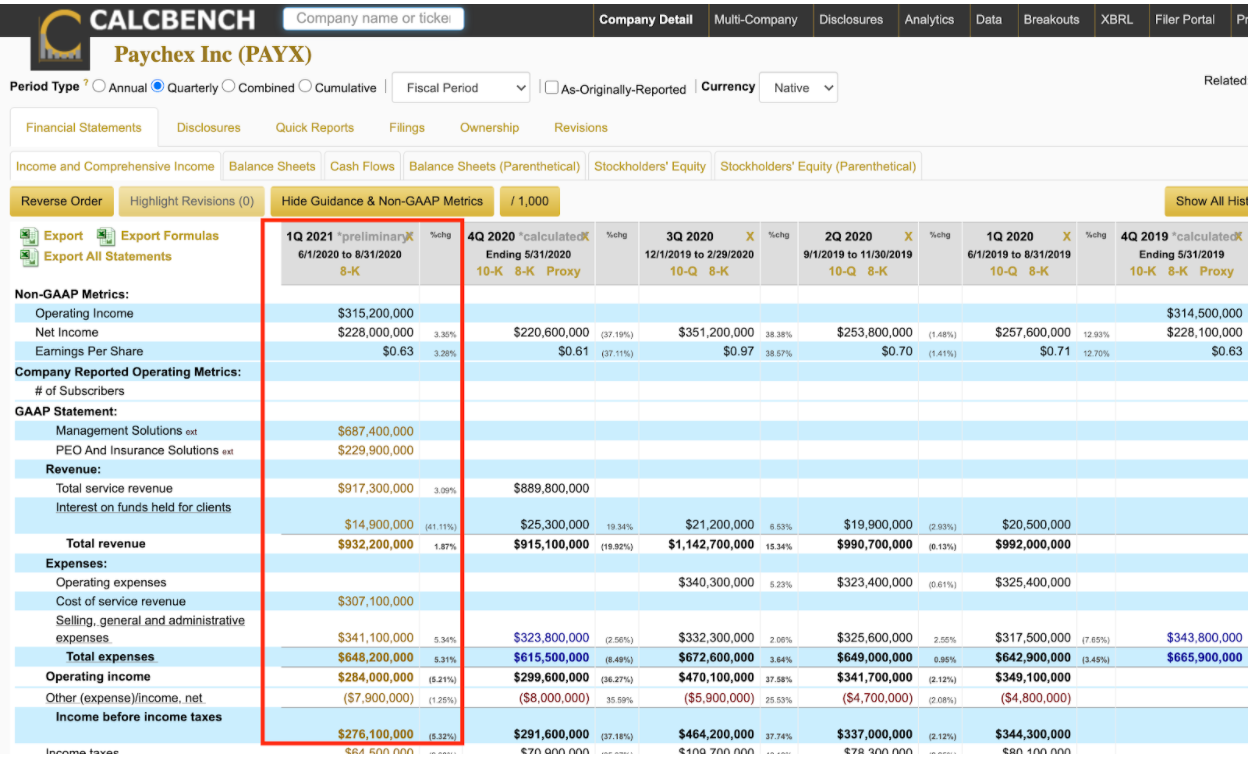
Visit Calcbench disclosures page and retrieve the 8-K in full or read it online. Or, for more information on our earnigngs press release tools, go to: https://www.calcbench.com/home/earnings_release_data

Standardized financials from Earnings Press Release and 8-Ks are now available via the Calcbench API minutes after published. Calcbench is leveraging our expertise in XBRL to get many of the numbers from the Income Statement, Balance Sheet and Statement of Cash Flows from the earnings press release or 8-K.
Data for the Dow 30 is @ https://www.dropbox.com/s/9rzxu81w2sitr9l/calcbench_pit_preliminary.csv?dl=0. The data starts in 2010.
The file includes numbers from the press-releases and the subsequent XBRL filings. True in the preliminary column indicates the number was parsed from an earnings press-release. True in the XBRL column indicates the number appeared in an XBRL document. Therefore, True in the preliminary and XBRL columns indicates Calcbench parsed the number from the press-release and subsequently “confirmed” it in the XBRL document, True in the preliminary column with False in the XBRL column indicates the number was parsed from the press release and was not subsequently “confirmed” in the XBRL 10-K/Q.
An unconfirmed number could indicate that the number was reported differently in the XBRL document sometimes it will just be a rounding error, or Calcbench parsed the number from the earnings release incorrectly. In the case where the XBRL number differs from a previously reported earnings release number the XBRL number will have a revision number greater than 0.
The date_reported column is when Calcbench published the data and it would have been tradable.
This file was created using the code @ https://github.com/calcbench/notebooks/blob/master/standardized_numeric_point_in_time.ipynb.
For a larger sample size and other questions email us@calcbench.com
Periodically at Calcbench, we take a look at the time between earnings announcements dates and the subsequent 10-K, or 10-Q. It was something that we originally did back in 2016.
We followed that up with another post in 2018.
So we took another shot today and looked at the most recent 10-Q filing period for 405 firms in the S&P500. Here’s a table of results. As you can see, 62.5% of firms in our sample, filed both documents within a day of each other, with over 40% filing in the SAME day!
Unlike in 2016 when we started tracking this data, today, we actually collect 8-K data and have clients using it. So if you want to learn more, drop us an email or use the chat function on calcbench.
Let us know if you want more.
| Days Btw Releases | Firms | % of Total | Cumulative %-age |
|---|---|---|---|
| 0 | 168 | 41.5% | 41.5% |
| 1 | 85 | 21.0% | 62.5% |
| 2 | 23 | 5.7% | 68.1% |
| 3 | 14 | 3.5% | 71.6% |
| 4 | 10 | 2.5% | 74.1% |
| 5 | 12 | 3.0% | 77.0% |
| 6 | 7 | 1.7% | 78.8% |
| 7 | 11 | 2.7% | 81.5% |
| 8 | 15 | 3.7% | 85.2% |
| 9 | 8 | 2.0% | 87.2% |
| >= 10 | 52 | 12.8% | 100.0% |
Many of our readers have also expressed the desire to see the list of the companies who publish both on the same day. Here they are:
| Company | Ticker | Date Filed |
|---|---|---|
| 3M Co | MMM | 4/28/20 |
| Activision Blizzard, Inc. | ATVI | 5/5/20 |
| Aes Corp | AES | 5/7/20 |
| Air Products & Chemicals Inc /DE/ | APD | 4/23/20 |
| Alexandria Real Estate Equities, Inc. | ARE | 4/27/20 |
| Alexion Pharmaceuticals, Inc. | ALXN | 5/6/20 |
| Allegion plc | ALLE | 4/23/20 |
| Alliant Energy Corp | LNT | 5/8/20 |
| Allstate Corp | ALL | 5/5/20 |
| Altria Group, Inc. | MO | 4/30/20 |
| American Airlines Group Inc. | AAL | 4/30/20 |
| American Electric Power Co Inc | AEP | 5/6/20 |
| American Express Co | AXP | 4/24/20 |
| American Tower Corp /MA/ | AMT | 4/29/20 |
| American Water Works Company, Inc. | AWK | 5/6/20 |
| Amerisourcebergen Corp | ABC | 5/7/20 |
| Ametek Inc/ | AME | 5/5/20 |
| Ansys Inc | ANSS | 5/6/20 |
| Anthem, Inc. | ANTM | 4/29/20 |
| Aon plc | AON | 5/1/20 |
| Apache Corp | APA | 5/7/20 |
| Aptiv PLC | APTV | 5/5/20 |
| Atmos Energy Corp | ATO | 5/6/20 |
| Baxter International Inc | BAX | 4/30/20 |
| Becton Dickinson & Co | BDX | 5/7/20 |
| Berkshire Hathaway Inc | BRK | 5/4/20 |
| Boeing Co | BA | 4/29/20 |
| Booking Holdings Inc. | BKNG | 5/7/20 |
| Borgwarner Inc | BWA | 5/6/20 |
| Bristol Myers Squibb Co | BMY | 5/7/20 |
| Broadridge Financial Solutions, Inc. | BR | 5/8/20 |
| Cabot Oil & Gas Corp | COG | 5/1/20 |
| Cadence Design Systems Inc | CDNS | 4/20/20 |
| Cboe Global Markets, Inc. | CBOE | 5/1/20 |
| Cbre Group, Inc. | CBRE | 5/7/20 |
| CDW Corp | CDW | 5/6/20 |
| Centene Corp | CNC | 4/28/20 |
| Centerpoint Energy Inc | CNP | 5/7/20 |
| Charter Communications, Inc. /MO/ | CHTR | 5/1/20 |
| Church & Dwight Co Inc /DE/ | CHD | 4/30/20 |
| Cincinnati Financial Corp | CINF | 4/27/20 |
| Clorox Co /DE/ | CLX | 5/1/20 |
| Cms Energy Corp | CMS | 4/27/20 |
| Colgate Palmolive Co | CL | 5/1/20 |
| Comcast Corp | CMCSA | 4/30/20 |
| Consolidated Edison Inc | ED | 5/7/20 |
| Cummins Inc | CMI | 4/28/20 |
| CVS HEALTH Corp | CVS | 5/6/20 |
| Danaher Corp /DE/ | DHR | 5/6/20 |
| Davita Inc. | DVA | 5/5/20 |
| Delta Air Lines, Inc. | DAL | 4/22/20 |
| Discovery, Inc. | DISCA | 5/6/20 |
| DISH Network CORP | DISH | 5/7/20 |
| Dominion Energy, Inc | D | 5/5/20 |
| DOVER Corp | DOV | 4/21/20 |
| DuPont de Nemours, Inc. | DD | 5/5/20 |
| Eaton Corp plc | ETN | 4/30/20 |
| Edison International | EIX | 4/30/20 |
| Eog Resources Inc | EOG | 5/7/20 |
| Estee Lauder Companies Inc | EL | 5/1/20 |
| Evergy, Inc. | EVRG | 5/6/20 |
| Exelon Corp | EXC | 5/8/20 |
| Federal Realty Investment Trust | FRT | 5/6/20 |
| Fidelity National Information Services, Inc. | FIS | 5/7/20 |
| Firstenergy Corp | FE | 4/23/20 |
| Flir Systems Inc | FLIR | 5/6/20 |
| Flowserve Corp | FLS | 5/7/20 |
| Fortive Corp | FTV | 4/30/20 |
| Franklin Resources Inc | BEN | 4/30/20 |
| Garmin Ltd | GRMN | 4/29/20 |
| Gartner Inc | IT | 5/7/20 |
| General Dynamics Corp | GD | 4/29/20 |
| General Motors Co | GM | 5/6/20 |
| Genuine Parts Co | GPC | 5/6/20 |
| Global Payments Inc | GPN | 5/6/20 |
| Hanesbrands Inc. | HBI | 4/30/20 |
| Hartford Financial Services Group, Inc. | HIG | 4/29/20 |
| Henry Schein Inc | HSIC | 5/5/20 |
| Hershey Co | HSY | 4/23/20 |
| Hess Corp | HES | 5/7/20 |
| Hilton Worldwide Holdings Inc. | HLT | 5/7/20 |
| HollyFrontier Corp | HFC | 5/7/20 |
| Hologic Inc | HOLX | 4/29/20 |
| Honeywell International Inc | HON | 5/1/20 |
| Humana Inc | HUM | 4/29/20 |
| Huntington Ingalls Industries, Inc. | HII | 5/7/20 |
| Idex Corp /DE/ | IEX | 4/24/20 |
| Idexx Laboratories Inc /DE | IDXX | 4/30/20 |
| Incyte Corp | INCY | 5/5/20 |
| Intercontinental Exchange, Inc. | ICE | 4/30/20 |
| Invesco Ltd. | IVZ | 4/23/20 |
| Ipg Photonics Corp | IPGP | 5/5/20 |
| Iron Mountain Inc | IRM | 5/7/20 |
| Jacobs Engineering Group Inc /DE/ | J | 5/6/20 |
| Johnson Controls International plc | JCI | 5/1/20 |
| Kansas City Southern | KSU | 4/17/20 |
| Kimberly Clark Corp | KMB | 4/22/20 |
| Kimco Realty Corp | KIM | 5/8/20 |
| Leidos Holdings, Inc. | LDOS | 5/5/20 |
| Linde Plc | LIN | 5/7/20 |
| Live Nation Entertainment, Inc. | LYV | 5/7/20 |
| Loews Corp | L | 5/4/20 |
| LyondellBasell Industries N.V. | LYB | 5/1/20 |
| Martin Marietta Materials Inc | MLM | 5/5/20 |
| Masco Corp /DE/ | MAS | 4/29/20 |
| Mastercard Inc | MA | 4/29/20 |
| Microsoft Corp | MSFT | 4/29/20 |
| Molson Coors Beverage Co | TAP | 4/30/20 |
| Mosaic Co | MOS | 5/5/20 |
| National Oilwell Varco Inc | NOV | 4/28/20 |
| Netflix Inc | NFLX | 4/21/20 |
| Newell Brands Inc. | NWL | 5/1/20 |
| NEWMONT Corp /DE/ | NEM | 5/5/20 |
| Nielsen Holdings plc | NLSN | 4/30/20 |
| Nisource Inc. | NI | 5/6/20 |
| Noble Energy Inc | NBL | 5/8/20 |
| Norfolk Southern Corp | NSC | 4/29/20 |
| Northrop Grumman Corp /DE/ | NOC | 4/29/20 |
| Norwegian Cruise Line Holdings Ltd. | NCLH | 5/5/20 |
| Nrg Energy, Inc. | NRG | 5/7/20 |
| Omnicom Group Inc. | OMC | 4/28/20 |
| PENTAIR plc | PNR | 4/30/20 |
| Pepsico Inc | PEP | 4/28/20 |
| Phillips 66 | PSX | 5/1/20 |
| Pinnacle West Capital Corp | PNW | 5/8/20 |
| PPL Corp | PPL | 5/8/20 |
| Public Storage | PSA | 4/30/20 |
| Pultegroup Inc/MI/ | PHM | 4/23/20 |
| Qualcomm Inc/DE | QCOM | 4/29/20 |
| Raytheon Technologies Corp | RTX | 5/7/20 |
| Regency Centers Corp | REG | 5/8/20 |
| Regeneron Pharmaceuticals, Inc. | REGN | 5/5/20 |
| Rockwell Automation, Inc | ROK | 4/28/20 |
| S&P Global Inc. | SPGI | 4/28/20 |
| Sealed Air Corp/DE | SEE | 5/5/20 |
| Sempra Energy | SRE | 5/4/20 |
| Sherwin Williams Co | SHW | 4/29/20 |
| Smith A O Corp | AOS | 5/5/20 |
| Snap-on Inc | SNA | 4/21/20 |
| Southern Co | SO | 4/30/20 |
| Southwest Airlines Co | LUV | 4/28/20 |
| Starbucks Corp | SBUX | 4/28/20 |
| T-Mobile US, Inc. | TMUS | 5/6/20 |
| Teleflex Inc | TFX | 4/30/20 |
| Tractor Supply Co /DE/ | TSCO | 5/7/20 |
| Trane Technologies plc | TT | 5/5/20 |
| TransDigm Group INC | TDG | 5/5/20 |
| Travelers Companies, Inc. | TRV | 4/21/20 |
| Tyson Foods, Inc. | TSN | 5/4/20 |
| Union Pacific Corp | UNP | 4/23/20 |
| United Rentals, Inc. | URI | 4/29/20 |
| Valero Energy Corp/TX | VLO | 4/29/20 |
| Ventas, Inc. | VTR | 5/8/20 |
| Verisign Inc/CA | VRSN | 4/23/20 |
| Verisk Analytics, Inc. | VRSK | 5/5/20 |
| ViacomCBS Inc. | VIAC | 5/7/20 |
| Vulcan Materials CO | VMC | 5/6/20 |
| W.W. Grainger, Inc. | GWW | 4/23/20 |
| Walt Disney Co | DIS | 5/5/20 |
| Waste Management Inc | WM | 5/6/20 |
| Western Union CO | WU | 5/5/20 |
| Weyerhaeuser Co | WY | 5/1/20 |
| Williams Companies, Inc. | WMB | 5/4/20 |
| Willis Towers Watson Plc | WLTW | 4/30/20 |
| Xcel Energy Inc | XEL | 5/7/20 |
| Xylem Inc. | XYL | 5/5/20 |
| Zebra Technologies Corp | ZBRA | 4/28/20 |
| Zoetis Inc. | ZTS | 5/6/20 |
Calling all devotees of operating lease assets: Calcbench just published a research note examining the potential impairment of those assets — which, as we say in the note, is no longer potential. It’s happening.
A PDF version of the research note is available to all. We review the changes to accounting rules that have compelled companies to start listing operating leases as assets on the balance sheet; and the rules that guide companies on when to declare an impairment of those assets; and several examples of operating lease impairments reported by actual firms in the last few months.
Of course, impairment of assets is not a new concept — but historically, financial analysts only got their undies in a twist over impairment of goodwill assets. Now that companies are also reporting operating leases as assets, those too can be impaired.
Well, how often might leased assets get impaired? Under what circumstances? Could those impairments lead to a material earnings surprise? Or are impairments more hype than substance, over a company’s long term?
We answer all those questions in the research note.
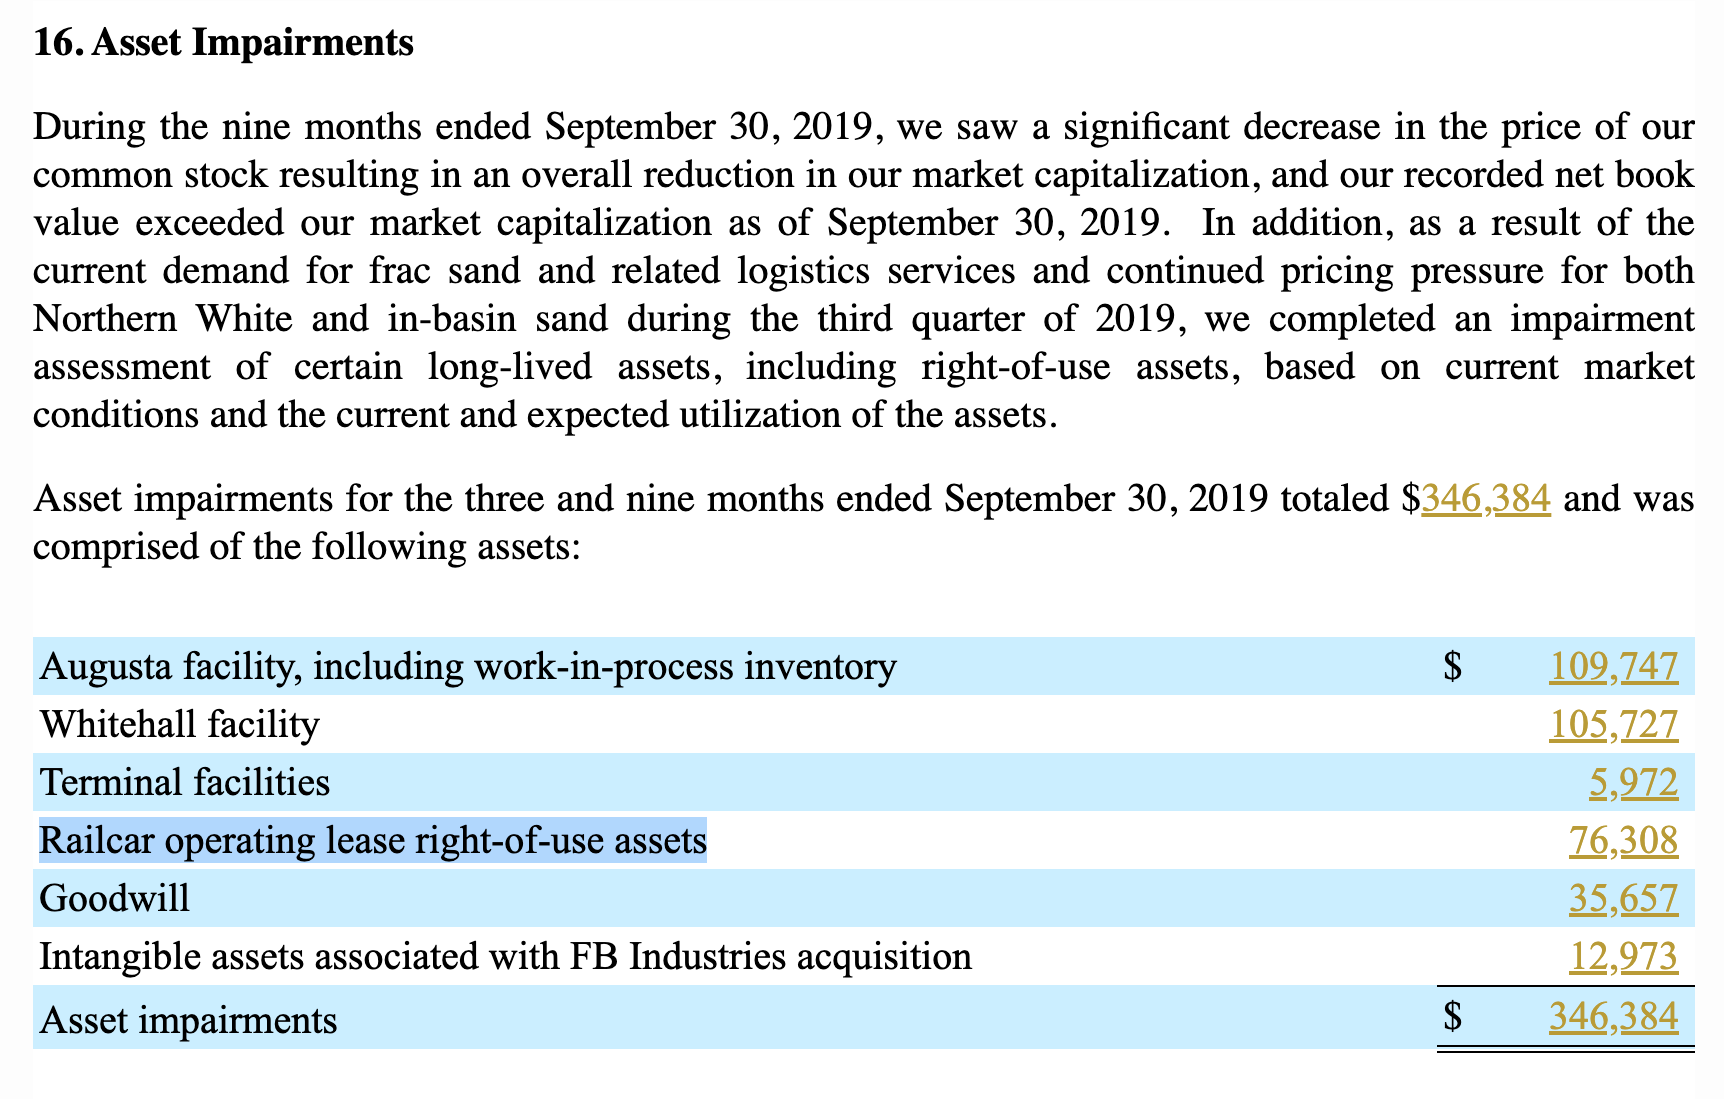
One good example: Hi-Crush Inc. ($HCR), a mining company that specializes in sand and other aggregates. Business did not go terribly well for Hi-Crush last year, and in Q3 2019 the company declared asset impairments totaling $346.4 million — including a $76.3 million impairment for leased railcars.
That was more than double Hi-Crush’s impairment for goodwill in the same period. So clearly impairment of leased assets can be significant. See Figure 1, below.
Anyway, the research note has several other examples, plus a discussion of the accounting rules that have brought us to this moment. If you need a primer on the issue and how Calcbench can help, give it a read!
The new accounting standard for leasing costs is no longer so new, but its secondary effects on financial reporting still are. Today Acuity Brands ($AYI) gave us one glimpse of that, when it declared an impairment on a leased asset.
What happened? Acuity, which sells indoor and outdoor lighting plus assorted other equipment, filed a rather yucky Q1 2020 report. Revenue down by 11 percent, operating profit down 36 percent, net income down 40 percent. The company also announced the arrival of a new CEO to turn things around.
What caught our eye, however, was a $6.9 million item on the income statement labeled “special charge.” See Figure 1, below; with the line-item highlighted blue.
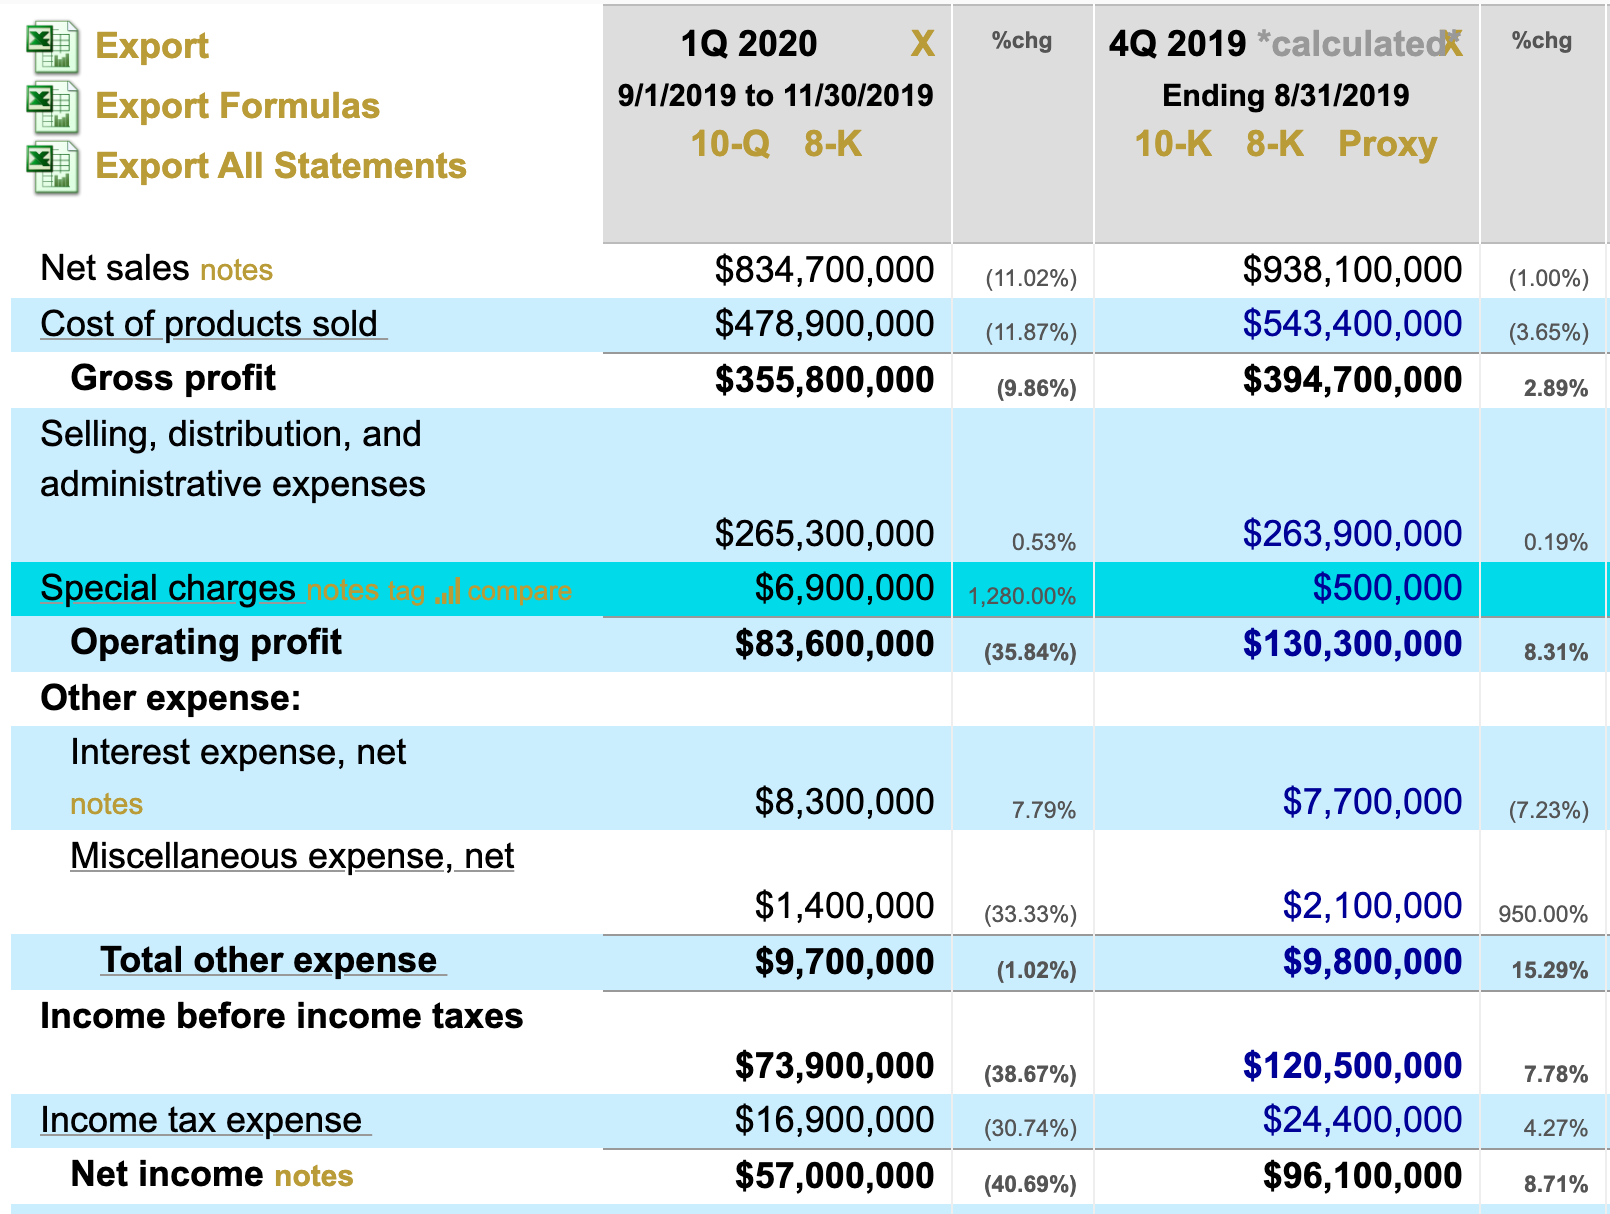
That $6.9 million was far larger than any other special charge Acuity has reported lately, and it’s always wise to look closely at special charges anyway. So we did, using the ever-handy Calcbench Trace feature.
In the footnotes, we then found this disclosure from Acuity:
During fiscal 2020, we recognized pre-tax special charges of $6.9 million. The fiscal 2020 special charge consisted primarily of severance costs and ROU asset lease impairments related to planned facility closures. Additionally, we recognized charges for relocation costs and ROU lease asset impairment charges associated with the previously announced transfer of activities from planned facility closures.
In other words, Acuity is closing a few facilities and that will cost it $6.9 million. Acuity goes on to say that $5.1 million of the charge will be related to severance costs, and the company had been accruing reserves to cover that amount — but the remaining $1.8 million is indeed an impairment of the leased facility Acuity had been using.
Why Is This a Big Deal?
This is a big deal because it demonstrates that the new lease accounting standard, which went into effect last year, can indeed affect earnings. Sure, in Acuity’s case this impairment isn’t a material amount of money — but until last year, you wouldn’t see something like this at all. Now you can.
The standard, ASC 842, requires companies to list their leased assets — commercial stores, airport gates, office equipment, data storage facilities, and so forth — on the balance sheet. The costs of the leases are listed as liabilities, the value of the leased items listed as assets. (We discuss all these issues at length in several white papers on our Research Page, if you want to know more.)
Like any other asset, however, that means the value of those leased items could fall, and the company would therefore need to declare an impairment. When that happens, the impairment is reported as a charge against earnings.
This happens with goodwill assets on a regular basis and sometimes with other intangible assets as well, so the idea isn’t new. It’s just expanding to a new type of asset: operating leases.
How common will this be? That’s hard to say right now. We’re not sure any other company has reported a charge like this. In theory, however, an impairment to leased assets might arise if a company signs a long-term lease for something and then economic circumstances around using that item change dramatically.
For example, a large bookseller might have signed a 20-year lease for commercial stores in 2011, and by now Amazon has whittled away the value of those stores — and if the locations are in crumbling shopping malls, who else is going to take that space off the bookseller’s hands before the 20-year lease expires in 2031? That’s how the lease accounting rule could end up forcing companies to serve up an earnings surprise.
Another question is whether these impairments would ever be material. In Acuity’s case, the impairment isn’t; even without it, the overall 10-Q numbers would still be pretty gross.
Still, for devotees of financial reporting, Acuity’s disclosure is a rare bird. We’ll keep looking to see whether any more fly by.

Yes, yes — we talk constantly about the new standard for disclosure of operating lease costs, and we just published an in-depth report about the new standard’s effect on the retail sector.
Well, we have even more. Today we look at how the new standard changes the return on assets for two of those retailers: Burlington Stores ($BURL) and Michaels Cos. ($MIK).
Return on assets (ROA) measures how efficiently a firm manages its assets to create a dollar of profit. It’s calculated as net income divided into total assets, and is expressed as a percentage. The higher the percentage, the more efficiently a firm puts its assets to work to make money.
But wait! The new leasing standard (ASC 842, if you care) requires firms to report the value of leased assets on the balance sheet. Mathematically, that means the standard is increasing the denominator of the ROA equation.
So could a firm see its assets expand so rapidly that ROA actually falls, even if net income goes up? Yes it could. Burlington Stores and Michael’s Cos. are two cases in point.
See Figure 1, below. It compares their net income and assets in Q4 2018, just before the ASC 842 standard went into effect; with the same numbers in Q2 2019, after ASC 842 arrived.
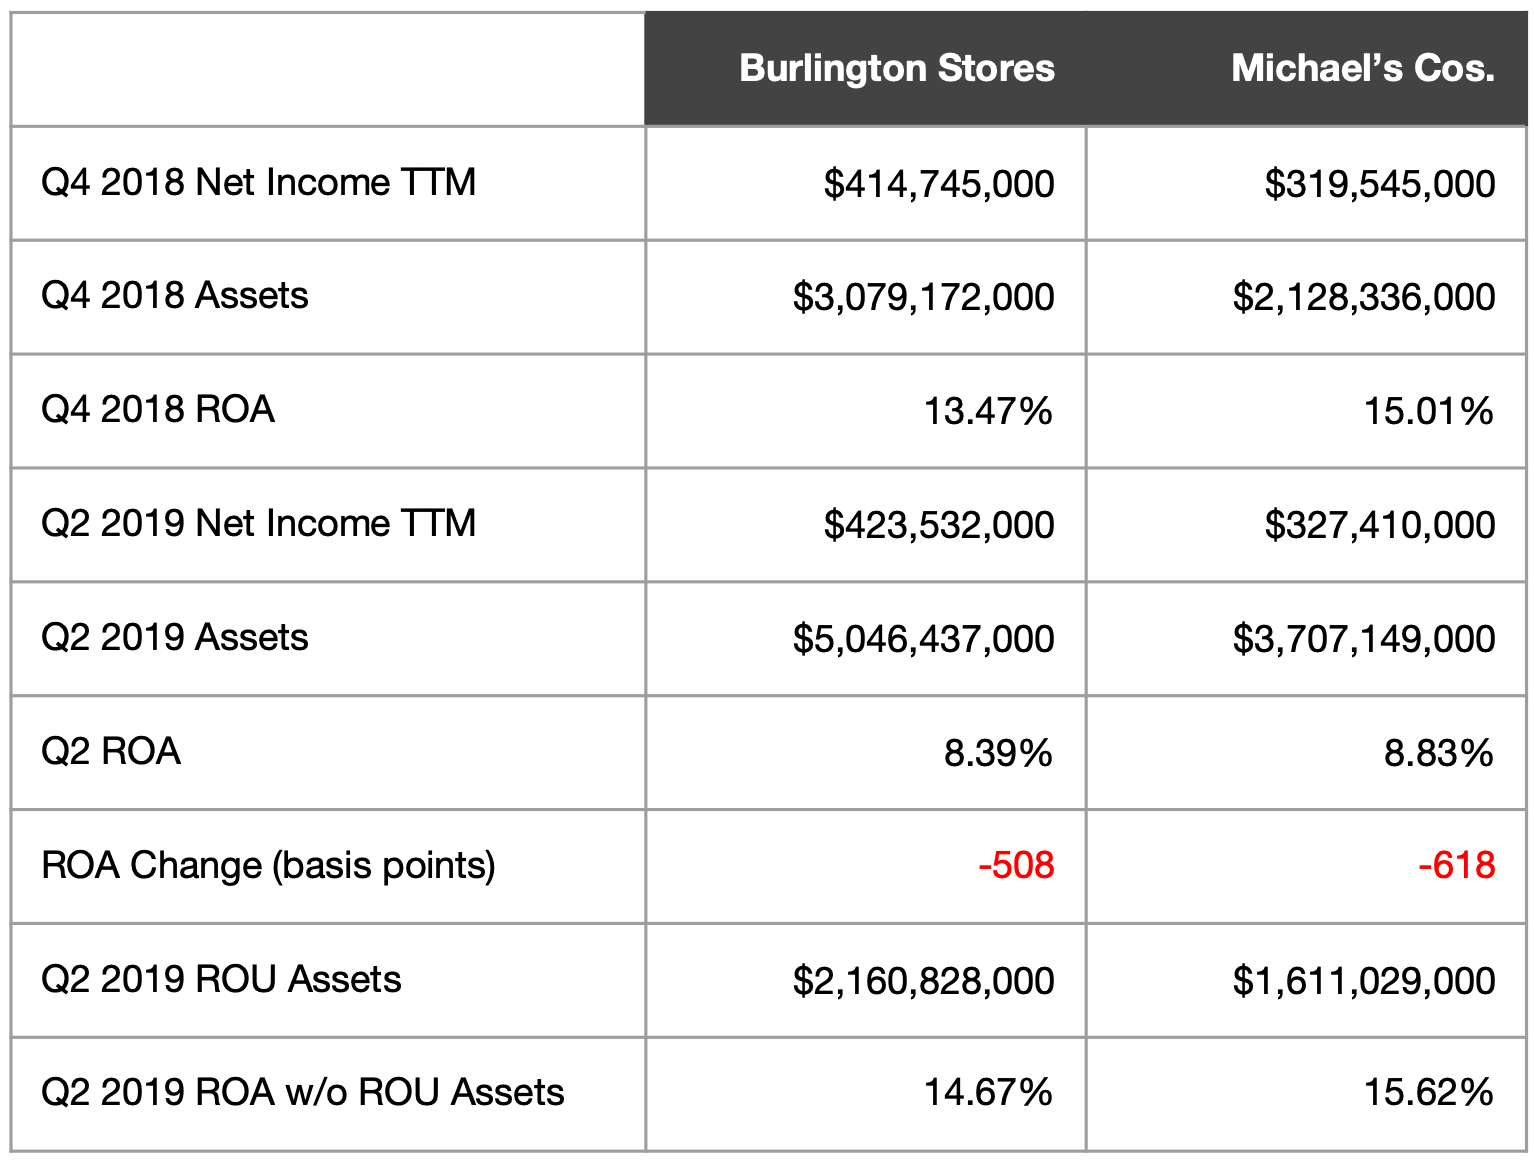
As you can see, ROA for both firms fell sharply, solely because of ASC 842. We calculated what their Q2 2019 numbers would have been without operating lease assets included. In both cases, ROA would have risen.
That change in operating metrics isn’t necessarily disastrous. After all, the business operations themselves didn’t change to any material degree; accounting rules did. The trick for firms in this predicament is to communicate the reasons behind that change clearly and effectively, so investors won’t misunderstand what’s happening.
Now we’re off to pick up a new coat and some crafting supplies. Winter is coming and we want to decorate our laptops for the holidays.
Devout readers of the Calcbench blog already know how much we love the new accounting standard for leasing costs. Now we have even more for those of you who also follow this subject closely: our latest in-depth look at leasing accounting costs among the S&P 500.
The new standard went into effect at the start of this year. It requires firms to report the costs of operating leases as liabilities on the balance sheet, and also to add a corresponding right-of-use (ROU) asset on the asset side.
In theory, leasing liabilities and ROU assets should offset each other. In practice, most firms have a discrepancy one way or the other between those two items — assets greater than liabilities, or liabilities greater than assets. Our paper examines the S&P 500 to see how large those discrepancies are.
The complete paper is available for download on the Calcbench Research page. Meanwhile, we have a few key findings here.
First, most firms do have discrepancies between assets and liabilities. Among the 382 firms in the S&P 500 that reported leasing items, only 21 had leasing liabilities and ROU assets in Q1 2019 where the values were exactly equal. Most firms had liabilities larger than assets, although a small number did have assets larger than liabilities.
To be clear — the discrepancies themselves are fine. They don’t violate financial reporting rules. The new accounting standard only aims to give investors a better sense of a firm’s assets and liabilities, and discrepancies are allowed. We just found lots of firms fitting that scenario.
Second, those discrepancies do add up. Collectively, those 382 firms had $475.2 billion in assets and $495.8 billion in liabilities. That means leasing liabilities exceeded ROU assets by 4.16 percent. The median firm had $434 million in assets and $446 million in liabilities, a difference of 2.69 percent. (See Table 1, below.)

When you examine specific firms those discrepancies can become significant, in either relative or absolute dollar terms.
For example, AT&T ($T) had $20.23 billion in assets, and $21.32 billion in liabilities. That is, its leasing liabilities were more than $1 billion larger than ROU assets. Meanwhile, Wynn Resorts ($WYNN) had ROU assets of $444.1 million, but liabilities of only $158.6 million.
Our report lists the firms with the largest differences in both absolute and relative terms. The names may surprise you.
Third, this new standard can have big effects on a firm’s balance sheet. Last summer we examined firms that were carrying large leasing liabilities off the balance sheet, under the prior accounting standard. We estimated how those firms’ total liabilities would increase if you added those off-balance sheet leasing liabilities onto the balance sheet. In some cases, total liabilities would increase 300 percent or more.
Now that the new standard is here, we revisited those same firms to see how their balance sheets actually did change in Q1 2019. Most of our predictions were close; a few were larger, and a few smaller.
Regardless, this standard can have a big effect on the balance sheet. That, in turn, has an effect on financial metrics such as return on assets or debt-to-equity ratios — all due to a change in accounting rules, rather than any change to business performance. (We did a deep dive on this issue just last week, looking at Chipotle Mexican Grille ($CMG), if you’re curious.)
Financial analysts need to understand and anticipate those changes in the firms that they follow. This research report provides a sense of what’s to come, and some specific examples that demonstrate the new standard’s practical effects.
You can also use Calcbench’s Company-in-Detail page or our Multi-Company page to further research firms yourself.
It’s a big change, this new lease accounting standard. Rest assured, Calcbench is on top of it and can give you the data you need, every step of the way.
We often talk about the new lease accounting standard on this blog. Today we’re going to explore one specific example of the consequences of the new standard — that is, how a change in accounting rules can lead to changes in a firm’s financial and operating metrics, without any change in actual finances or operations.
Fellow data devotees, we give you Chipotle Mexican Grill ($CMG).
As you might know, the new lease accounting standard requires firms to report the value of operating leases on the balance sheet. The cost of a firm’s operating leases shows up in the liabilities section, while the value of those leases appears in the asset section as a right-of-use (ROU) asset.
For retailers, who lease lots of space, those numbers can be substantial. Since important performance metrics like a firm’s return on assets or its debt-to-equity ratio derive from total assets and liabilities, that means any big shift in total assets or liabilities will also change those metrics.
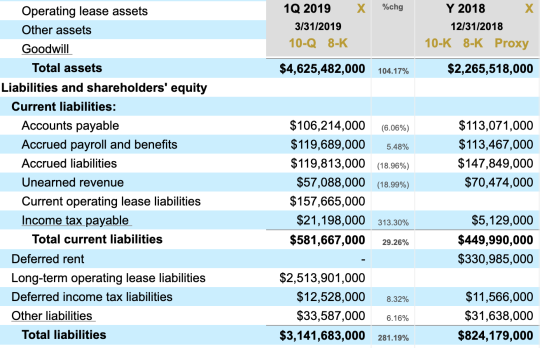
Chipotle is an excellent example of this. In relative terms, its leasing obligations are substantial. So when it implemented the new standard in Q1 2019, the size of its balance sheet ballooned. Total assets more than doubled from $2.26 billion at the end of 2018 to $4.63 billion in Q1. Total liabilities went from $824.18 million to $3.14 billion — an increase of (gulp) 281 percent.
See Figure 1, below. We zoomed into the liabilities because that’s the bigger shift, but you can also see the shift in total assets near the top.
So what does this mean for Chipotle’s performance metrics? Lots.
We’ll first look at return on assets, calculated as net income divided into total assets. To smooth out any seasonal changes, we’ll compare first-quarter 2018 (before the new lease accounting standard) to first-quarter 2019 (after the standard). See Table 1, below.
| Q1 2018 | Q1 2019 | |
|---|---|---|
| Net Income | $59,446,000 | $88,132,000 |
| Total Assets | $2,097,444,000 | $4,625,482,000 |
| Estimated ROA* | 11.3% | 7.6% |
That’s a steep drop in ROA even after a quite respectable jump in net income, all because a new accounting standard changed the location of where Chipotle reported a number.
Chipotle’s debt-to-equity ratio, calculated as total liabilities divided into total shareholder equity, also changes. See Table 2, below.
| Q1 2018 | Q1 2019 | |
|---|---|---|
| Total Liabilities | $733,399,000 | $3,141,683,000 |
| Total Equity | $1,364,045,000 | $1,483,799,000 |
| Debt to Equity | 0.54 | 2.12 |
In both cases, we have significant changes in performance metrics without any comparable shift in, ya know, actual performance. This sort of thing will happen to all firms as they adopt the new lease accounting standard — although as Chipotle demonstrates, it will happen to some firms much more severely than others. Changes in those metrics can also have real consequences, such as triggering a debt covenant or perhaps influencing the strategy of some automated trading algorithm out there.
Calcbench automatically presents debt-to-equity ratio when you examine a firm’s balance sheet in the Company-in-Detail page. You can also search for ROA and debt-to-equity in our standardized metrics in the Multi-Company page. And don’t forget, we have leasing research galore on our Research page.
* We annualized Net Income to project the total ROA
Calcbench subscribers who use our email alerting function know it’s that time of the quarter again — the time for a flood of earnings releases, quickly followed by quarterly reports. So today let’s have a refresher course in all the ways Calcbench can help you digest the data in earnings releases.
First, as we just mentioned, you can configure your account to receive email alerts any time a company that you follow files an earnings release. Just visit your account preferences at https://www.calcbench.com/account/emailalertpreferences, where you’ll see a list of all our standard peer groups, any peer groups you’ve created, or individual companies you follow. Along the top are the types of alerts available for each group — including earnings releases.

Check that box for whatever companies you want, and within minutes of those companies filing an earnings release, you’ll see an email from Calcbench giving you the head’s up.
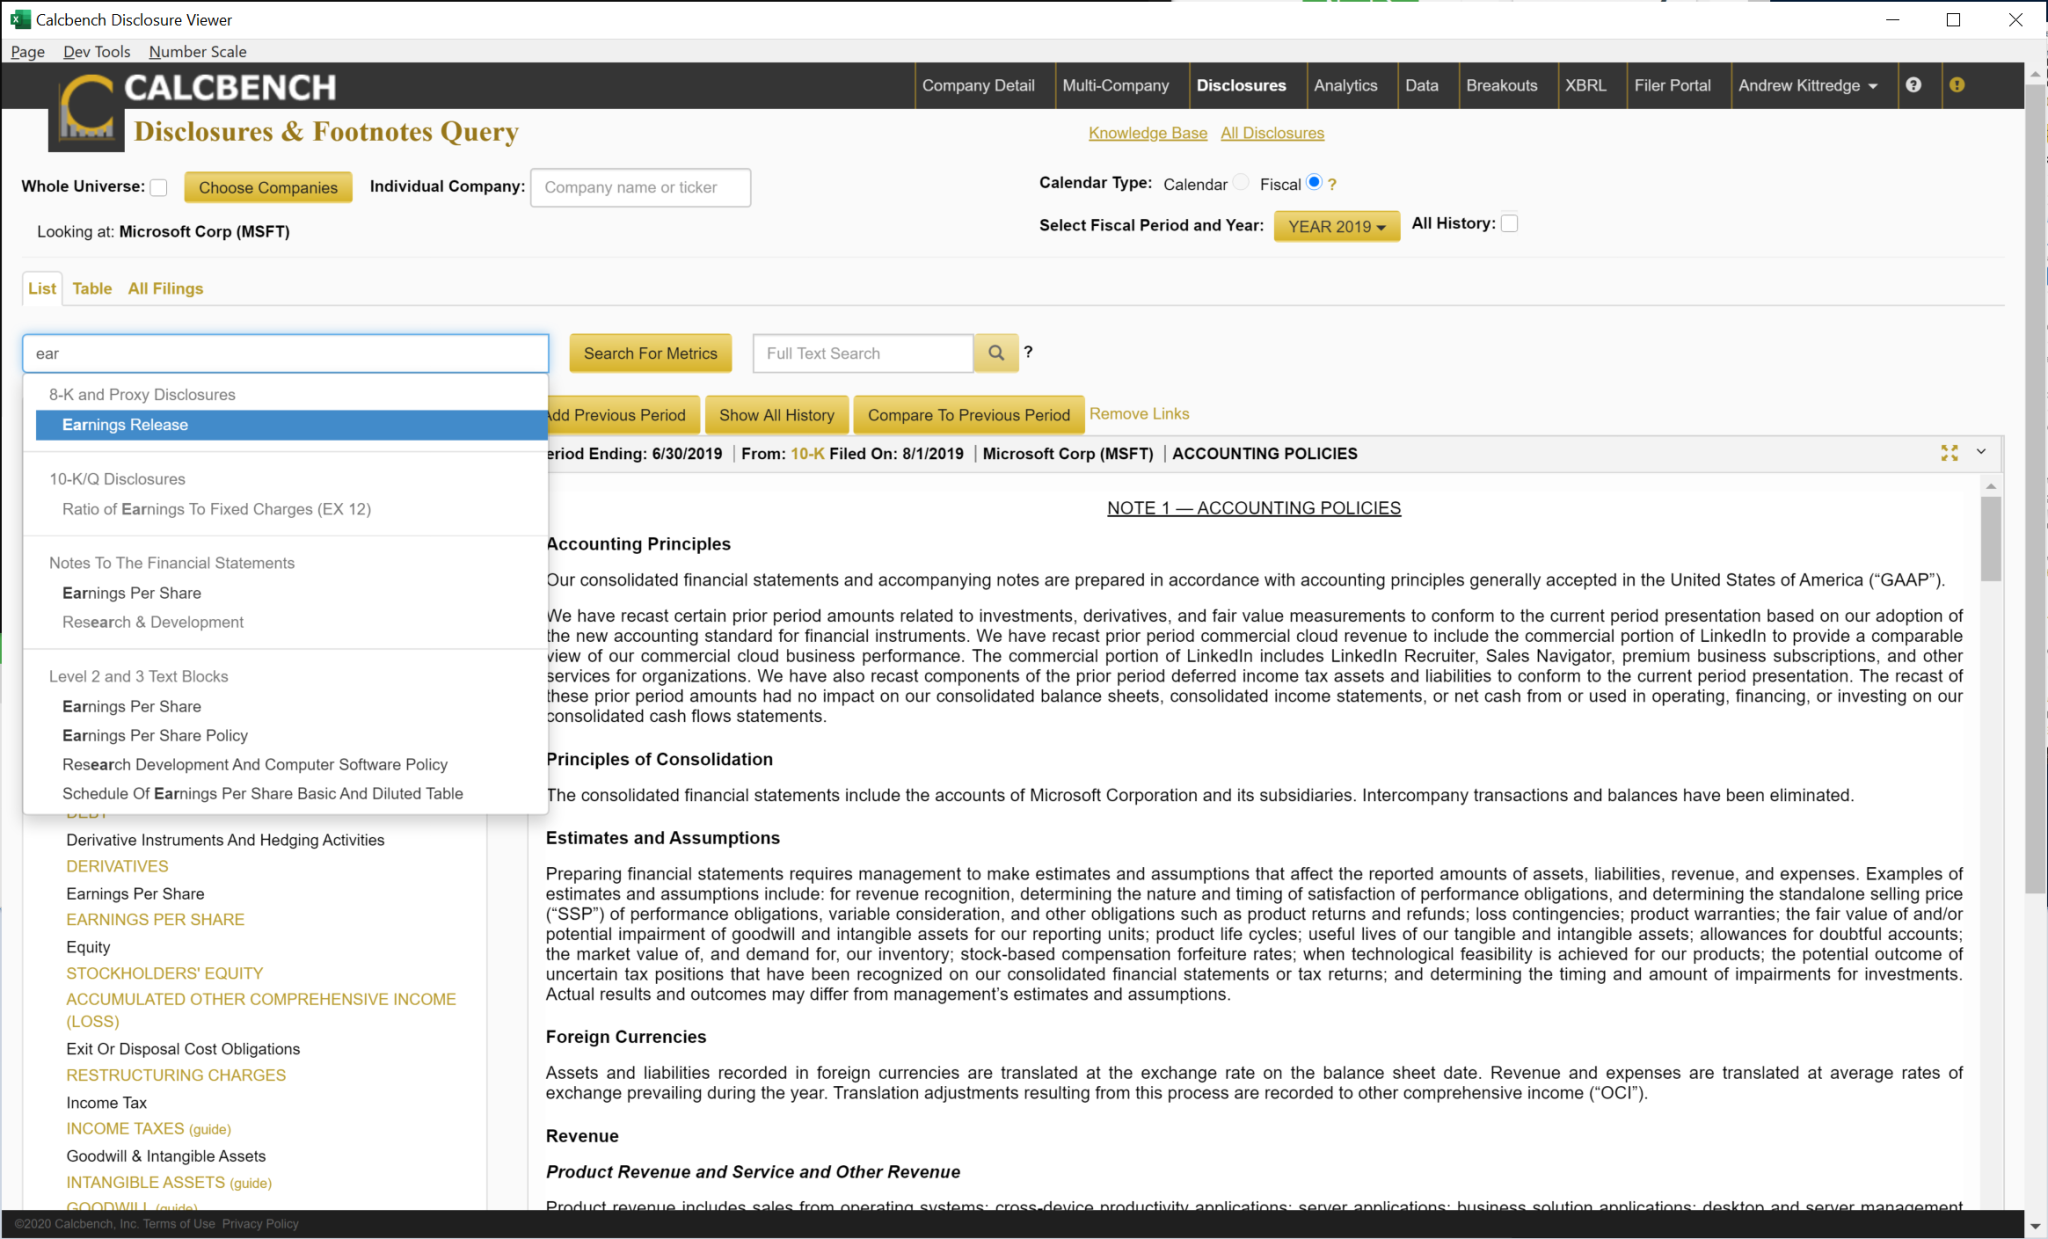
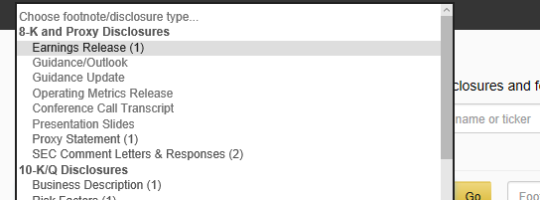
Second, you can use our Interactive Disclosure Viewer to read those earnings releases once they’re filed. In the pull-down menu on the left side of that page, you’ll see Earnings Releases as an option under “Choose Footnote/Disclosure Type.”
So on that page, first select the companies and the period (or periods) you want to search. Then select “earnings releases” on the left, and those earnings releases will appear on your screen. Notice you can also choose other options such as “Guidance Update” or “Guidance/Outlook” if you want to narrow your search to companies changing previous guidance. See Figure 2, below.
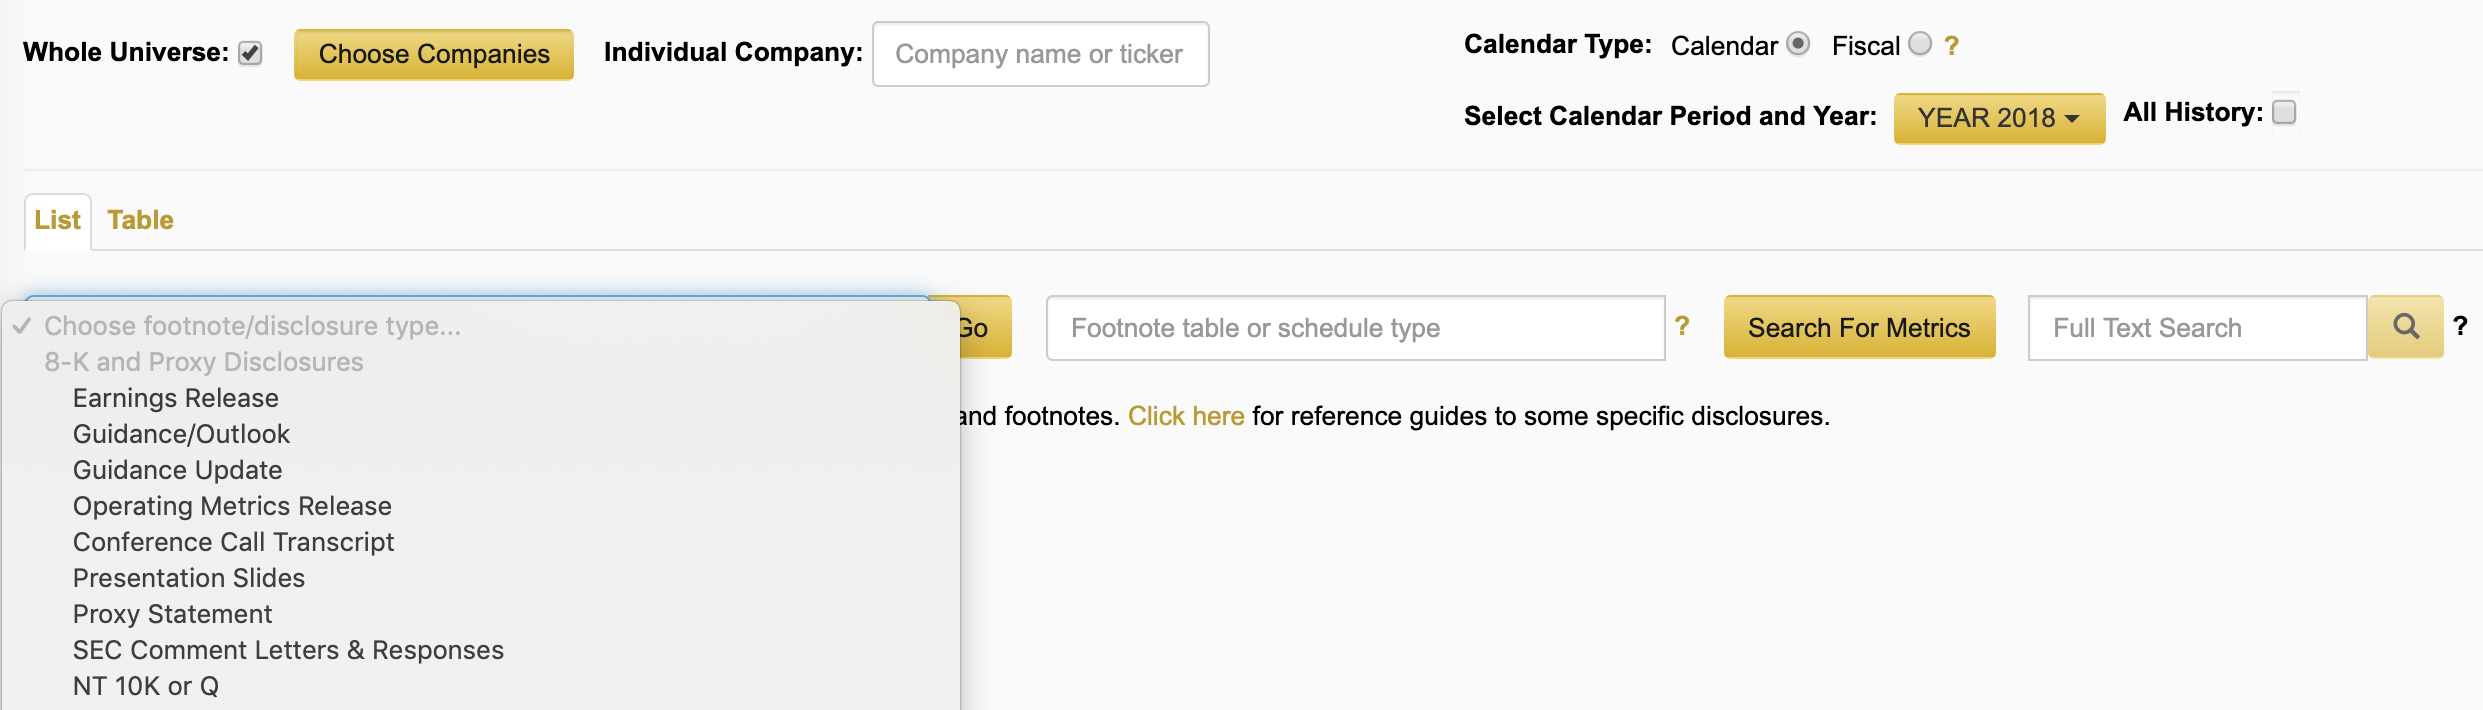
As always with this page, you can also enter text in the box on the right side, too; in case you wanted to search, say, all earnings releases in the S&P 500 for first-quarter 2019 that use the word “tariffs.” We can give you those results in a jiffy.
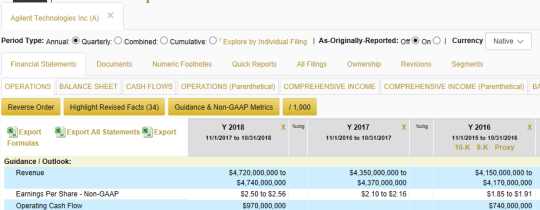
Third, our Company-in-Detail page can show you any non-GAAP metrics or other guidance a company might have included in an earnings release, along with the corresponding data filed in the quarterly report.
Simply select the “Show Guidance & Non-GAAP Metrics” button when viewing a company’s financial details. Figure 3, below, shows an example from Telsa’s ($TSLA) 2018 annual report.

Fourth, download and read our Earnings Release Analysis Guide if you want an in-depth look at earnings releases and how Calcbench processes that data. It’s 20 pages of all the background you might need on when earnings releases are filed, how companies typically present information in that document, and the tags Calcbench uses to bring that data to you clearly, quickly, and easily.
So there we were, poring over earnings releases and annual reports, because that’s what we do around here in our spare time, when we came upon Alaska Air Group ($ALK).
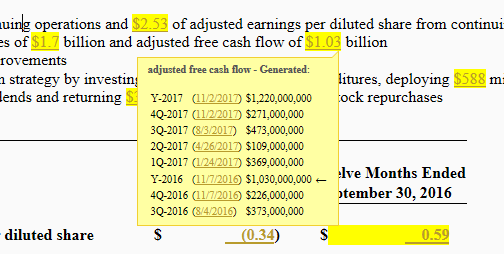
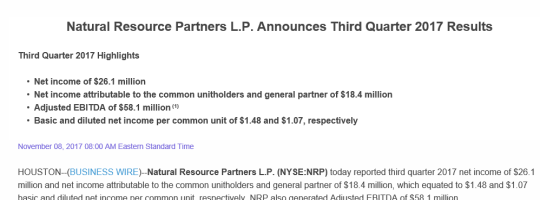
That’s when we noticed: the company’s earnings release for full-year 2017 results, filed on Jan. 25, 2018, proudly said net income was $1.028 billion, up 26.3 percent from the prior year.
But wait! On the full 10-K that Alaska Air filed on Feb. 15, it listed net income as $1.034 billion — $6 million more than the number it reported just 21 days earlier.
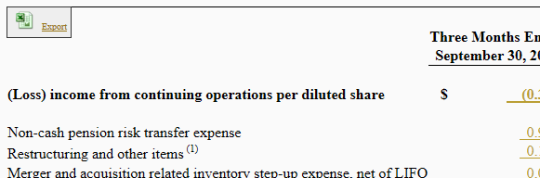
What happened? Take a look at how Alaska Air reconciled its non-GAAP net income on the earnings statement (at right), compared to its full income statement filed in the 10-K (at left). Look closely.
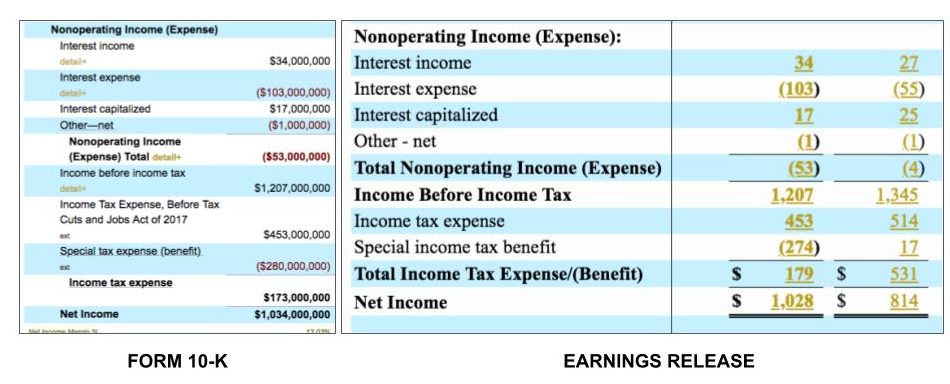
Do you see it? The “special tax (benefit)/expense” in the earnings release was reported as a $274 million benefit, but that number changed to $280 million by the time the 10-K was filed. That explains the $6 million increase in net income.
According to a footnote in the earnings release, the benefit arose from remeasuring deferred tax liabilities after Congress passed the corporate tax cut in 2017. Apparently that remeasurement was adjusted by the time the Form 10-K was filed. That is legal; numbers in earnings releases don’t have any liability attached to them and aren’t audited, and the amount isn’t material anyway.
Still, our Alaska Air discovery did make us wonder: What other discrepancies do companies have between the 8-K earnings release and the 10-K annual report?
Another good example comes from AmerisourceBergen ($ABC) and its results for fiscal 2017. When Amerisource filed its earnings release on Nov. 2, 2017, it clearly reported net income as $414.5 million. But in its Form 10-K, filed on Nov. 21, net income had dropped to $364.5 million — a decrease of $50 million, or 12 percent. Which is not an immaterial amount of money.

Upon closer inspection, we can see that Amerisource increased its expense for employee severance and litigation by $50 million; that’s the cause of the net income discrepancy. If you compare footnote disclosures in the earnings release and the 10-K (folks, always read the footnotes), we can see the $50 million is specifically an increase in litigation settlements, from $864.4 million to $914.4 million.
Then you can use our Interactive Disclosure page to pull up AmerisourceBergen’s discussion of legal matters and contingencies. It’s a long list, including subsidiaries tampering with syringes to dilute oncology medicines and pending opioid legislation.
We didn’t do a sentence-by-sentence comparison to pinpoint exactly which legal troubles pushed up the settlement budget by $50 million, but any analyst following AmerisourceBergen could. That’s what Calcbench lets you do.
And, as we can see from these two examples, analysts probably should, too. A lot can change between the earnings release and the 10-K.
Calcbench has been hot on the new accounting standard for operating leases lately, since the standard goes into effect on Dec. 15 and could have significant implications for companies that carry large operating lease obligations on their balance sheet.
Now, if you want an example of just how significant those implications can be, look no further than rival shipping giants FedEx and UPS.
We picked them because the two firms are roughly similar in revenue, net income, assets, and liabilities. FedEx, however, pursues a business model where it leases much more space than UPS does. The upshot: FedEx’s obligations for future lease payments are 11 times larger than those for UPS.
Now, recall that the new lease accounting standard requires companies to report those future lease payment obligations as liabilities on the balance sheet; and to add a corresponding “right of use” asset on the asset side of the balance sheet too.
Well, return on assets equals net income divided by total assets. So when you add items to the asset side of the balance sheet, you are expanding the denominator of that formula and your ROA must decline. It’s math.
Take a look at this comparison of FedEx and UPS, all pulled from Calcbench data.
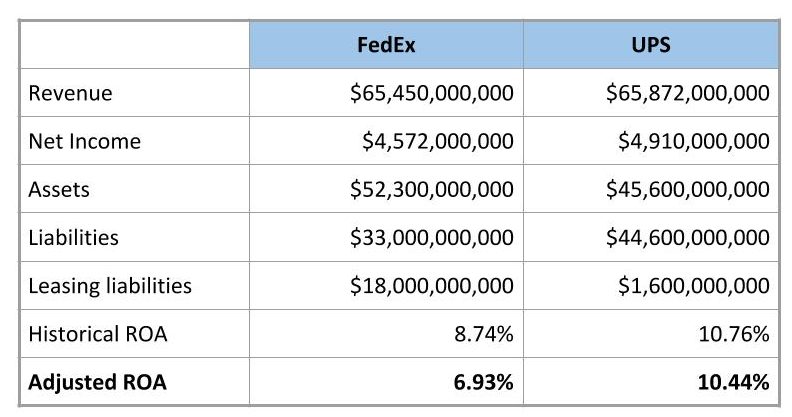
We examined the companies’ current leasing obligations, added them to the liabilities side, and then added an equal amount to the asset side for the offsetting right-of-use asset. Then we recalculated an adjusted ROA according to the new leasing standard.
This is the result: Two companies of similar size, but one (FedEx) experiencing a considerable change in ROA simply because of an accounting change, rather than some fundamental change in business operations.
Financial analysts, therefore, might want to ask FedEx on its next earnings call: do you have any debt covenants that might be triggered when ROA falls below 7.5 or 7 percent? Do any executive compensation agreements tie to ROA? Anything else we should know about involving changes to ROA?
You get the picture. (Like, literally; we supplied the picture three paragraphs above.) Calcbench can dig up the data you need. Whether you feed it into your own Excel models or just fiddle around on the fly, we have it. You can find it.
As we noted in a post last week, a new accounting standard for operating leases comes into effect at the end of this year, where leasing costs must be reported on the balance sheet as liabilities.
Today we want to explore the opposite end of that exercise: what about all the leased goods that companies will add to the balance sheet as assets?
After all, the goal of new standard (ASC 842) is to help investors understand both the costs and benefits of all those operating leases. So while we all tend to talk about leasing costs on the liabilities side, we can’t forget that a corresponding adjustment will also take place on the asset side, too.
For example, a company’s return on assets is likely to change because the company will be adding assets. ROA is a performance metric analysts use to assess how well a company can turn a dollar of investment into profit. You calculate ROA by dividing net income into total assets, and express the result as a percentage. The higher the percentage, the better a company’s ROA.
But if you add leased assets to the balance sheet, the denominator of that equation gets bigger, which means the ROA percentage will get smaller — because of a change in accounting rather than a change in underlying business operations. Consider this hypothetical example below, where we increase assets by 40 percent (a very reasonable estimate of what companies might report). Hmmm.

What We Did
First, we visited our Multi-Company Page and pulled up what the S&P 500 reported in 2017 for net income and total assets. That would let us calculate “normal” ROA. We also pulled up each filer’s future lease payments (which you can do with the normalized metrics Calcbench tracks), and added that number to total assets, under the theory that the costs on the liabilities side must equal the value on the asset side.
We’re not sure that technique is entirely street legal in the world of financial analysis, but it’s a good approximation to assess our general point: that filers’ ROA could change in spring of 2019 when the new standard starts showing up in corporate 10-Ks, and possibly to a material extent.
What We Found
Collectively, the S&P 500 had $1.05 trillion in net income last year and $34.4 trillion in assets. That’s a return on assets of 3.04 percent. The S&P 500 also had $631.32 billion in future lease payments as liabilities. If you add that amount to total assets, then adjusted ROA falls to 2.99 percent.
Is that a lot? We’re not sure, although any time a metric crosses some significant threshold — like crossing from one whole number to the next — we could imagine automated trading programs going nuts, without necessarily understanding what’s really happening.
We also measured the spread for each company between its true ROA and the adjusted ROA it would have reported if the leasing standard had been in effect, and ranked them from largest spread to smallest. Here are our top 10.

No surprise that all 10 are consumer brands with stores or outlets across the country. (With the sole exception of Alaska Air, which leases aircraft and gate space.)
We noticed one other mathematical quirk. If a company reports a net loss, by definition its ROA will be negative, because division or multiplication including a negative number always results in a negative answer.
OK, but that also means adding to the asset portion of the formula increases ROA. Take a look.

Financial analysts may question the wisdom of that result. If a company is already losing money, and now we’ve added even more assets that it needs to invest into income, is the situation improving or not?
It’s an interesting question, and one you may want to pose to a CFO on that next earnings call once the new leasing standard goes into effect.
Most public companies file with the SEC both an earnings press release (through a Form 8-K) and an annual report (Form 10-K). The timing of the annual report is determined by the company’s filer status. For example, a large accelerated filer (a public float of more than $700 million) needs to file its 10-K within 60 days of the fiscal year end. The timing of the 8-K, however, is determined primarily by the company.
To file the 10-K the companies need their auditors’ approval, since the auditor’s letter is part of the filling. The earning press release does not require such approval.
Following up on our previous post on the topic, we wanted to take another look at the timing of both the earnings press release (the 8-K) and the annual report (the 10-K).
We examined all companies that have filed their 2017 annual report to date. We calculated average days from the fiscal year-end (FYE) to the filing of the 8-K and 10-K. We also calculate the percentage of time until the filing of the 8-K out of the total time until the filing of the 10-K. (For example, 100% would mean that both were filed on the same day).
2017 Annual 10-Ks Submitted |
||||
|---|---|---|---|---|
| Avg. Days FYE to 8K | Avg. Days 8K to 10K | Avg. Days FYE to 10K | Avg. Percent Time to 8K | |
| Large Accelerated Filer | 41.7 | 12.2 | 57.2 | 77.8% |
| Accelerated Filer | 53.5 | 13.9 | 70.3 | 80.4% |
| Non-Accelerated Filer | 54.8 | 10.8 | 79.7 | 84.1% |
| Smaller Reporting Company | 70.3 | 10.1 | 90.5 | 87.7% |
As can be seen from the table above, Large Accelerated Filers file their 10-K quicker than the other filers. That is no surprise; they are required to do so by law.
What is interesting is that, relatively, they file their earnings press release more quickly than other filers. That is, they publish the 8-K quickly (41 days on average after the FYE) and then spend more time working on their 10-K. The delay between the 8-K and 10-K is smaller (relatively) for the other (smaller) filer categories.
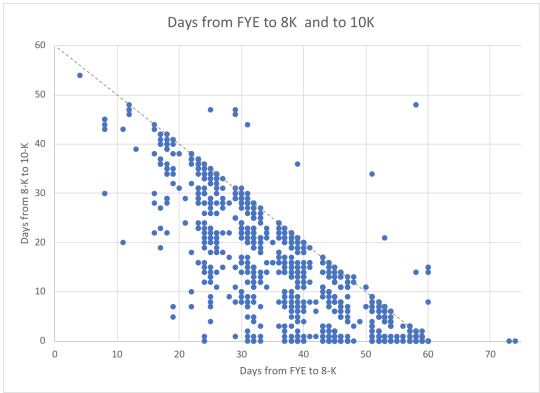
Closer look at Large Accelerated Filers
We wanted to take a closer look at the Large Accelerated Filers. We charted the number of days from the FYE to the 8-K and from the 8-K to the 10-K. All companies should have been below the diagonal line (file the 10-K within 60 days), and the vast majority did. In general, the closer the company is to the origin, the faster it files.
Conversely, the further from the origin (especially beyond the diagonal line), the longer it takes for them to file.
What is interesting though, is the timing of the 8-K relative to the 10-K. Companies on the X axis filed both the 8-K and 10-K on the same day, whereas companies higher in the chart had more of a delay.
We wanted to see whether the timing of the 10-K and delay between the 8-K and 10-K is associated with some other measures. We divided the Large Accelerated Filer to quartiles based on the days between the FYE and the filing of the 10-K.
Speed of 10-K Filing |
||
|---|---|---|
| Avg. %-age of time to 8K | Avg. Revenue (USD Billion) | |
| Very Fast | 81.4% | 11.6 |
| Fast | 76.4% | 8.2 |
| Slow | 76.0% | 7.0 |
| Very Slow | 77.7% | 3.1 |
We found that the companies that file the 10-K faster are larger and have less of a delay between the 8-K and the 10-K. This result may be a little surprising considering that larger companies are typically more complex and may require more time to prepare and audit the annual report. This result could, however, be driven by the market demand for information from the larger companies.
In our previous post we talked about all of the data you can find in earnings press releases. Now we’ll see how we can use that data. (Click here to download our full Earnings Release Analysis Guide.)
First of all, keep an eye on our Recent Filings Page. You can see all of the press releases coming in today or a different day: www.calcbench.com/recentfilings.
From there you can click to go directly to that press release in our financial statements viewer, or our interactive disclosure viewer.
1) Using Our Disclosure Viewer:
Pick a single company or group of companies you’re interested in (more about that here).
Choose Earnings Release from the drop down list of disclosure topics:
If you are interested in just the most recent releases…click ‘Most Recent’ from the period menu:

Otherwise, pick a period and year, OR pick ‘All History’ if you want to look at a company or companies over time.
Now you can read the filings, and…
Export individual tables to excel:
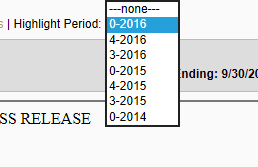
Highlight a specific period’s numbers for ease of use:
Look at number histories:
Or EVEN BETTER, if you use our (super awesome) Excel Add in, you can:
Open our disclosure viewer from Excel:

Go through the same steps above, and then just click on numbers, or whole tables, to populate your model:
2) How to Use Press Release Data in the CID or Multi-company Page:
If there are full financial statements in a press release, we will merge that data with our existing financial statements for the company…in line-item detail as always! You can see this on the Company in Detail page for the particular company.
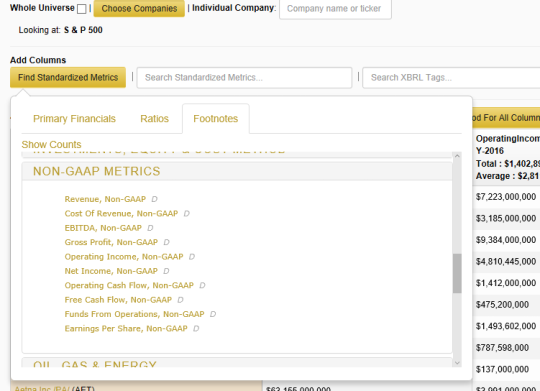
Also, we collect some of the individual data topics
contained in earnings releases.
Click the ‘Guidance & Non-GAAP Metrics’ button to see values for the focus company:
In addition, we standardize some of the Non-GAAP metrics, Guidance, and Operating Metrics so you can see the history over time. You can find these standardized metrics in the metric explorer when you go to our Multi-Company page.
Earnings Press Releases are the customary way for public companies to report highlights from a recently ended quarter to the press and public before they file their formal SEC filing.

Not every company issues an earnings release, and the style and information contained by the press release will vary from company to company.
In general earnings press releases take two forms: Preliminary and Standard, with some companies using both, and others just one or the other.
A preliminary earnings release usually contains a small set of ‘preliminary’ (subject to change) financial results, like revenue and cash flow, often times heavily rounded or presented in ranges. This is to give investors a quick overview of the quarter just ended even while the final numbers are still being double checked.

A standard earnings
release on the other hand will normally contain ‘final’ numbers presented
in greater detail. The majority of companies include at least a full income
statement. Many will contain a balance
sheet and even cash flow statement as well.
In addition to being released in advance of the company’s formal annual or quarterly report, earnings press releases also contain some important information that may not be found in the formal 10-K or 10-Q at all:
1) Non-GAAP financial metrics:
These ‘adjusted’ metrics are the companies’
attempt to tell their story on their own terms. These metrics are derived from ‘official’
GAAP numbers, but include adjustments in order to help analysts better understand
the company’s results.
This often involves removing ‘non-recurring’ items like restructuring costs, or non-cash items like share based compensation.
The running joke of course is that these adjustments almost always end up making the company look far better off than the GAAP numbers would suggest. For this reason regulators have been taking pains recently to make more rules about what is and is not appropriate. However, you should always use them with at least some skepticism.
All non-GAAP financial metrics must include a reconciling table to show how they were calculated. This will usually appear near the bottom of the release.
There are other rules about NON-GAAP metrics here: https://www.sec.gov/divisions/corpfin/guidance/nongaapinterp.htm
2) Guidance/Outlook:
Many companies provide future predictions about
their expected performance. They will choose a few metrics and give an
approximation of what they expect for the coming quarter and/or coming year.
Looking at the company’s past actual performance as compared to its past guidance estimates can give you an idea how well you can trust their current predictions. Some companies have a history of under promising, which means they try to ‘guide low’ and then ‘beat’ each quarter. Other companies try to hit their guidance exactly.
Guidance will sometimes be updated as the period goes on and new information is available. Companies are required to make public to everyone any new information they give to anyone about their financial standing and predictions, and generally must also file a copy of this information with the SEC in the form of an 8-K.
3) Non-GAAP Industry Specific Operating Metrics:
For example, Monthly Active Users, Backlog/Bookings, Comparable Store Sales, Customer ‘Churn’, and others.

These are additional metrics that add more detail about the company’s performance.
These items may seem straightforward, but always
remember there are no strict definitions that apply across all companies. So,
one company’s churn calculation may differ from another’s, for example, making
them incomparable. If you are using these metrics to compare one company to
another, make sure you check the definitions.
Next Up…How to use Calcbench to Research Earnings Releases.
Also,
Click here to download our full Earnings Release Analysis Guide.
Now you can click on numbers in 10-K/Qs and Earnings Press Releases to instantly insert Calcbench formulas directly into Excel. You can use this to build a model based on face financials or footnotes to the financials in minutes.
To open the window click on the Launch Disclosure Viewer button in the Calcbench Add-in Menu in Excel -
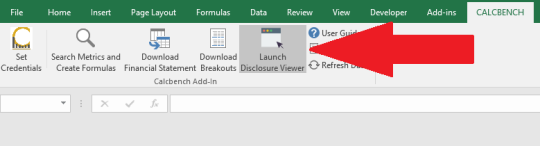
The standard Calcbench disclosure viewer will open -

When we open XBRL disclosure and click numbers in gold a formula will be inserted into Excel and the value will be retrieved -
The Company-Detail and Multi-Company pages are also rigged up for click-to-insert-formula. If you open the Company-Detail page in the Disclosure Viewer window you can click on the numbers in the face statements to insert formulas.
If you need to enter a bunch of numbers from 10-K/Qs into Excel quickly sign up for a Calcbench trial @ https://www.calcbench.com/join and download the Excel Add-in @ https://www.calcbench.com/home/exceladdin.
Our latest look at operating lease expenses is available on the Calcbench Research page. For financial analysts or anyone else following the telecom, consumer, or utilities sector, you may want to take a close look.
Those three sectors have the highest average leasing liability currently off the balance sheet—which a new accounting standard, going into effect in 2018, will put on the balance sheet, for the first time ever. Some companies, and the investors who follow them, may be in for a jolting experience.
And for those of you following companies in other sectors, don’t worry. The new standard will probably be a jolting experience for you, too.
The standard is known by a few names: ASU 2016-02, ASC 842, or its plain old English language name, “Leases.” It goes into effect for reporting periods ending on or after Dec. 15, 2018, so companies have less than 18 months left to (1) calculate the effect of the new standard on their financial reporting; (2) make any adjustments to internal controls, financial processes, or debt covenants as necessary; and (3) communicate to investors about what’s going on.
Right now, operating lease expenses are only reported in the footnotes. Companies typically disclose leasing costs in each of their next five fiscal years, plus all other “future years,” with a total exposure summed up at the bottom.
Calcbench can track those footnote disclosures in our Interactive Disclosure database, and we do. So our latest research report (intimidatingly titled “Operating Leases: What Lies Beneath”) examined what companies are reporting in the footnotes about leasing costs. Some quick facts:
- 379 firms in the S&P 500 reported nearly $400 billion in off-balance sheet leasing costs in 2016, for an average of just over $1 billion per firm;
- 1,649 firms not in the S&P 500 reported $190 billion in leasing costs, for an average of $115.6 million per firm;
- The four companies with the largest total leasing liabilities were AT&T ($23.1 billion), Walgreens-Boots Alliance ($22.8 billion), CVS Health ($18.1 billion), and Verizon ($14.4 billion).
We also compared those off-balance sheet leasing liabilities to liabilities already listed on the balance sheet—and yes, for more than a few companies, complying with ASC 842 will cause their total liabilities to balloon. Potbelly Corp.’s total liabilities would increase by 469 percent, Chipotle Mexican Grill’s by 367 percent. Our research report has a list of the 25 firms facing the biggest spikes in total liabilities.
The report also has two specific examples of how companies are reporting their lease liabilities now, and how that’s likely to change come December 2018.
We’ll be following the leasing standard closely in coming months, including the disclosures companies make about how their implementation plans are proceeding. For now, you can get the full report— or any of our other insightful reports on financial reporting issues—on our Research page.
Corporate filers and financial analysts, prepare yourselves: the next big change in financial accounting has pushed off the docks and is sailing to a balance sheet near you.
The change is a new lease accounting standard, adopted by the Financial Accounting Standards Board in February. The standard directs companies to report the cost of all leases on the balance sheet for the life of the asset, whether that asset is office equipment, real estate, vehicles, or anything else with a lease attached to it. The update does not go into full effect until 2019, but since companies will need to present three years’ worth of financial data retrospectively, you should prepare to panic starting with your 2017 fiscal year.
Historically, only capital leases had to be listed on the balance sheet. The cost of operating leases could be kept in the footnotes, where it received less attention. Now those operating leases will go on the balance sheet as well. (Only leases of less than 12 months will still be excludable.)
The numbers involved potentially are huge. One LeaseAccelerator study found that listed companies have a collective $3.3 trillion in leasing obligations, and 85 percent of that is not disclosed on balance sheet. Calcbench did some research of our own, and found that the number of firms reporting operating leases, plus the average dollars committed to operating leases, are bouncing around within a narrow range. (Note that our 2015 numbers are for filings year-to-date, and not complete.)
| Year | Total Dollars Leased | Average Leased Per Firm | Firms Leasing |
|---|---|---|---|
| 2012 | $1,818,231,907,999 | $464,871,497.31 | 3,911 |
| 2013 | $1,378,860,735,980 | $364,367,002.38 | 3,784 |
| 2014 | $1,770,674,625,277 | $452,886,364 | 3,910 |
| 2015 | $1,042,756,552,740 | $363,524,829.60 | 2,868 |
If you want to do more sophisticated analysis of leasing costs yourself, you can start with our Calcbench Operating & Capital Lease Disclosure Overview. That document explains how to use our database platform to find and study leasing disclosures, and how to use our Excel add-in if you want to export the data to your own templates.
The good news about the standard: the accounting and reporting legwork involved (that is, moving your disclosure from footnote to balance sheet) shouldn’t be too hard unto itself. The consequences of putting lease costs on the balance sheet, however, are where things might get tricky.
For example, companies will want to review whether their new asset and liability numbers have any effect on debt covenants, or on earnings per share. We also have that pesky fundamental equation of financial reporting: Assets = Liabilities + Shareholder Equity. So if your liabilities rise because of all these new leasing costs, either shareholder equity will fall, or you will need to increase assets by an equal amount. As seen above, that equal amount might be quite large.
You have concerns beyond simple balance sheet reporting, too. Audit firms might question the strength of your internal controls around leasing, to confirm that you capture all lease data promptly and accurately. If your business has lots of vendor service agreements, you will want to see whether those agreements include the leasing of equipment as part of the deal; that will need to be reported.
Those questions about operations are beyond the scope of what Calcbench addresses, but corporate finance executives should have no illusions—you’ll be answering those questions soon enough. Meanwhile we do have a few other materials you might find useful.
At Calcbench we specialize in analyzing ‘interactive’ SEC filings…filings that are tagged using the machine readable XBRL format. These filings largely consist of annual and quarterly reports from most every company traded in the U.S.
However, a common criticism of the SEC’s XBRL system is that earnings press releases are not required to be tagged in XBRL. These press releases are documents that give an overview of a company’s results for the period, and they often come out days or even weeks before the full quarterly or annual report.
This means that people relying on interactive data often times have to wait a little while to get financial information that has already been released by the company. We’re working to change that.
Starting this month we are incorporating non-interactive data from earnings press releases into our platform.
To start, we’ll be displaying press release data in our Company in Detail page. You’ll see it marked as ‘Preliminary’, because it is not from a formal XBRL document. When the 10-K or Q arrives, the preliminary column will be replaced with the complete interactive data.
One picture…
Just go. You will see this. (NOTE: You must be logged in)
If you don’t have a login, just sign up HERE!

One of the most enlightening aspects of financial statement analysis is in examining the footnotes of firms. Calcbench set out to systematically analyze the off-balance sheet debt of US firms by first looking at the commitments that these firms have made in their leasing obligations (report here) . What we found was eye-opening.
First, the idea that a firm will lease assets is nothing more than a financing decision. A lease gives the lessee, the right to use an asset (e.g. store, computer or vehicle) for a specified term and expense. Since the lessee does not assume the risk of ownership, the lease does not have to be put onto the balance sheet. In many cases, this simple action may distort the assets and liabilities of the underlying firm.
So we asked a few simple questions.
1. What would balance sheets look like if operating leases were put back onto the balance sheet?
2. Which firms / sectors will be most effected?
3. How have these obligations changed over time?
Our results are summarized in the Operating Lease Report on our website. Please download it and have a look for yourself.
But, here are some highlights. Retail trade and Manufacturing have the largest estimated liabilities in the S&P500. This is not unexpected as they have large property, plant and equipment obligations.
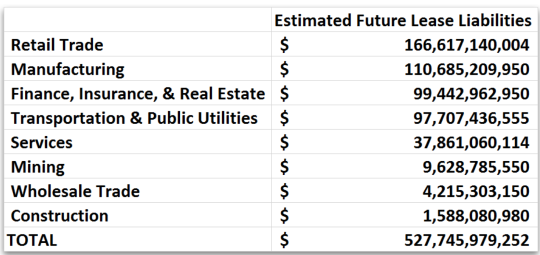
What was surprising to us was in the firm level observations. It appears that in several cases in the retail sector, the off-balance sheet lease obligations are of significant size. In a few cases, they are 1 or 2 times the size of the 2014 Total Liabilities of the firm! In over 50 specific firms off balance sheet operating leases represent more than 15% of the outstanding liabilities!!
All of this would not be possible without extensible Business Reporting Language (XBRL).
Last week we began our series of Analysis Guides with a piece on Analyzing Tax Disclosures in financial statements. This week we continued it with a Lease Template example. This post is a meant to serve as a primer on what our customers can do with the lease template.
First, get one of our templates by downloading it from
https://www.calcbench.com/home/guides
Enable the macros and connect to Calcbench.
Next (assuming you pick the lease template), select a firm by putting the symbol into the cell B3. You can also change the year in B4 and the Assumed Interest Rate in B5.
Once you have done the above, you will see that the Present Value of Lease Liabilities (PVLL) is calculated on an annual basis for you. In addition you will get the Interest Expense, Depreciation and Tax Deduction calculated. On the far right in cell I20, you will get the estimated amount that would be placed onto the liabilities side of the balance sheet.
We also provide you with our Lease Ratio, which simply takes the PVLL and divides it by Current Liabilities and Total Liabilities. Finally, we estimate the PPE increase that is implied if Shareholders Equity were to stay constant for the firm in question.
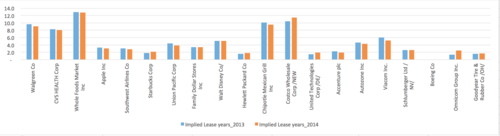
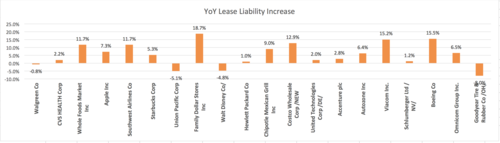
Since, we are data scientists, we decided to build a macro based on our template and run this spreadsheet for the S&P 500 constituents for 2013 and 2014. The graph below shows the change in lease Liabilities on a year over year basis for firms that have reported both 2014 and 2013 results so far (through today, 2/19/15). You might interpret increases in Lease Liabilities as confidence, or perhaps not.
Also attached are the Implied Lease years for each of the firms. This is an imputed, or estimated, number based on the dollar amounts beyond the standard 5 year lease reporting period and current leasing behavior. As you see, Whole Foods, Costco and Chipotle report the most dollars committed to the future.
This is just the start of things that we are doing. Call us for more. us@calcbench.com
Family Dollar is the biggest YoY increase (percentage wise) and this is before the Dollar tree merger!
Implied Lease Years. E.G. Whole Foods at over 17 years (first 5 reported + 12 implied)! #Confident.